
Table of Contents
The teaching series, spread over 12 monthly articles, aims to provide a basic to intermediate understanding on a range of topics, including momentum, volatility, moving averages, basic patterns, cycles and the Elliott Wave Theory.
An FLD is a replica cycle plotted a half wavelength forward in time from the original cycle. If you can picture in your mind a semicircle representing a cycle, then the FLD is a copy of that semi-circle overlaying the original, but offset forward. So in effect there are now two overlapping semicircles. The proper name for FLD is the clunky sounding “future line of demarcation”
The job of Hurst cycles analysis is to back engineer the composite cycle (i.e. what we see as price action over time on the chart) and resolve it into its constituent cycles, find their troughs and peaks and work out where we are in the cyclic scheme of things at the right edge of the chart. An FLD can be generated for any cycle in the nominal model. Among other things, the interaction of price and FLDs allows us to estimate the future time and price of peaks and troughs and to gauge future trend direction. The following examples should make this clear.
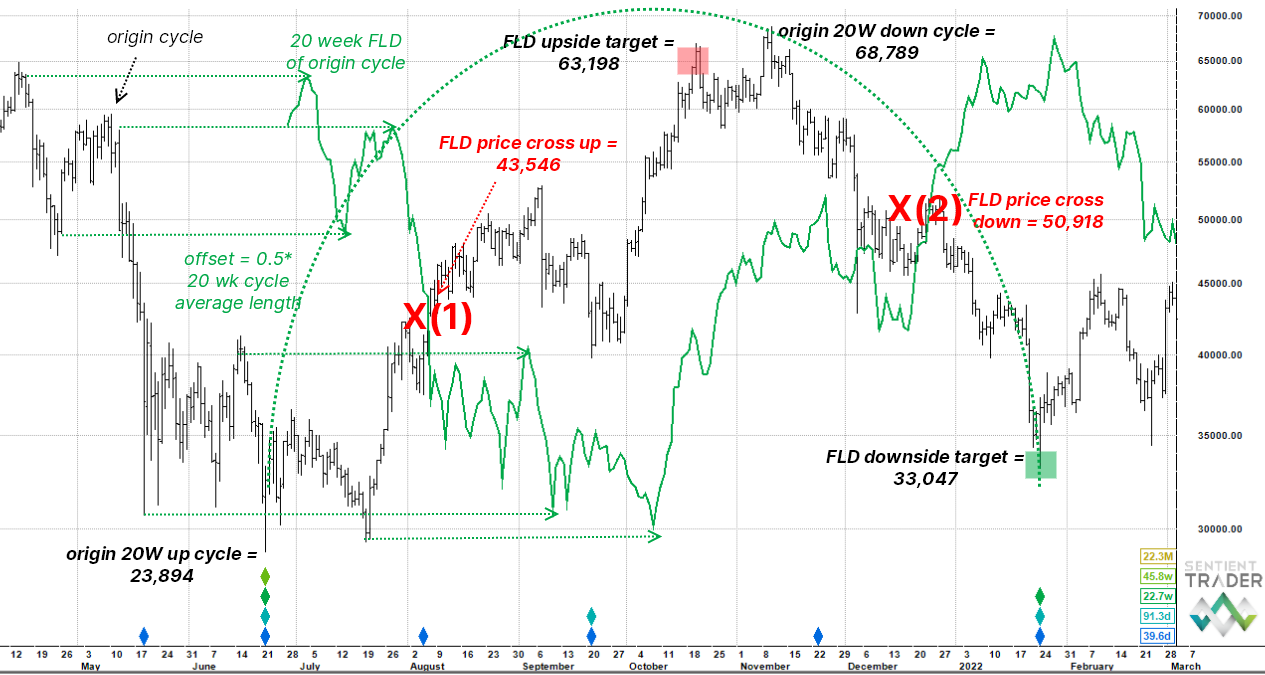
A 20 week FLD has been generated by offsetting a line to the right of price at each date by one half of the wavelength of the 20 week cycle (the wavelength is 22.7 weeks shown at the bottom right of the chart, so the offset is 11.3 weeks). The FLD is an exact duplicate of the original price line.
The horizontal arrows stacked down the left hand side of the chart show the offset in action. You might notice that there is a slight difference between the FLD inflections and the origin price, this is because FLDs use median price (high + low)/2. Notice also that as the FLD falls in future time, for example August, price is rising at that time; and as the FLD rises in future time, for example December, price is falling at that time.
The primary use of the FLD in the Hurst Cycle notes service will be as a target measurement tool and to confirm the magnitudes of recent peaks or troughs. Let’s start at the 22 June diamond stack marking the time location of the 40 week cycle trough. The 40 week cycle is represented by a light green diamond and our cycle of interest, the 20 week cycle, is the dark green diamond just below it in the stack. The arc of the entire cycle has been plotted and the next trough is estimated to occur in the last week of January 2022.
The origin price is the 22 June low of 23,894. Price rallies with the new 20 week cycle and meets the falling 20 week FLD on 7 August at 43,546 X(1). With these two pieces of information, we can now estimate an initial target for the 20 week cycle peak. We do this by subtracting the origin price from the FLD cross price and then adding the difference to the cross price. This generates an upside target of 63,198 which turns out to be 92% of the actual peak price, which came in at 68,789 on 10 November. The reason the FLD projection fell a bit short is covered in the next section.
Now let’s consider the downside target. Using the 10 November peak as the new origin price (68,789), price falls and meets the rising 20 week FLD on 24 December at 50,918 X(2). Subtracting the FLD cross price from the origin price and then subtracting the difference from the cross price generates a downside target of 33,047 (the actual low was 33,184 i.e. a little lower).
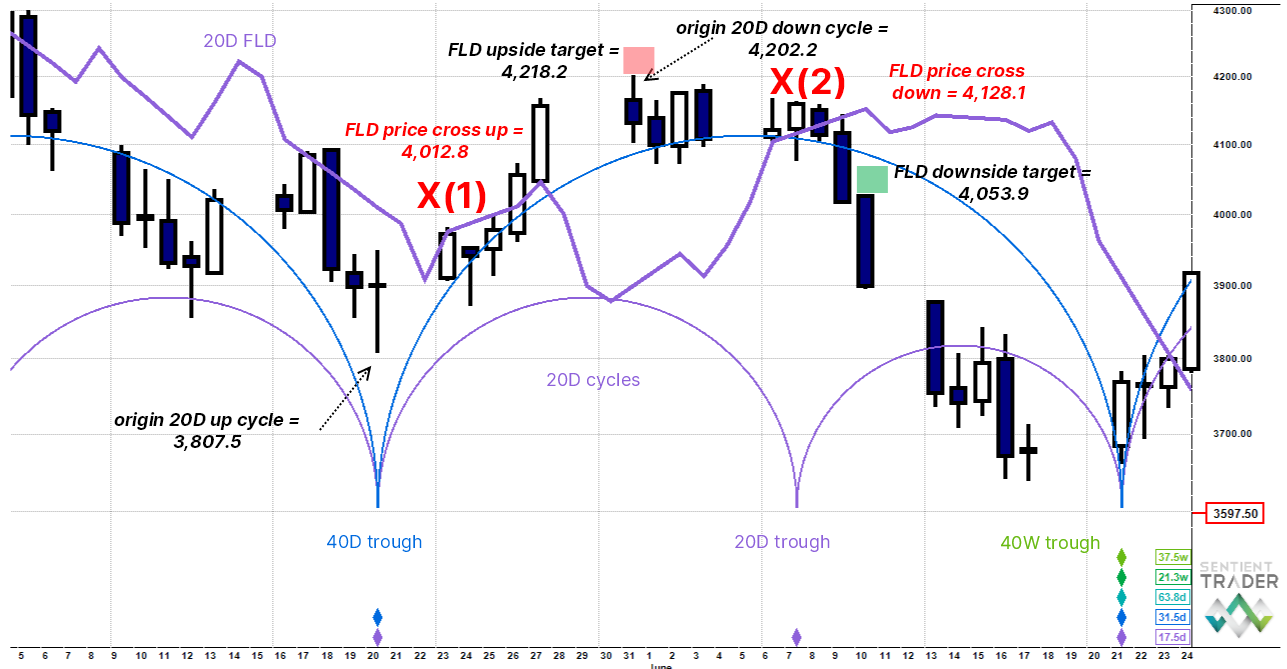
Here we are looking at the 20 day cycle and 20 day FLD. The start of the 20 day cycle is the low of 20 May (3,807.5), price rises to meet the FLD on 26 May at 4,012.8 X(1) generating an upside target estimate of 4,218.2 (as a reminder we subtract the origin price from the cross price and add the difference to the cross price). The actual peak came in somewhat lower at 4,202.2. The reasons behind why did it undershoot should become clearer when we examine the downside leg, but basically its because the 20 day cycle was under downward pressure from longer, falling cycles. When FLDs either exceed or miss their targets it tells us something about the bigger picture.
It gets interesting on the downside leg now because price is actually falling into a major low, that of the 40 week cycle trough. In real time this would have appeared on the chart as a nest of lows shown by circles and whiskers. We would have known the magnitude of the upcoming trough and have been prepared for a sharp sell off into it.
The origin price for the downside leg is the 4,202.2 top and prices fall to meet the rising 20 day FLD at 4,053.95 X(2). However this only generates a downside target estimate of 4,053.9, which is clearly way too short. In real time you would have expected a price overshoot to the downside because of the looming big trough and not just randomly closed out at X(2). You would have needed to step up to the next longer cycle 40 day FLD. So let’s look at that now.
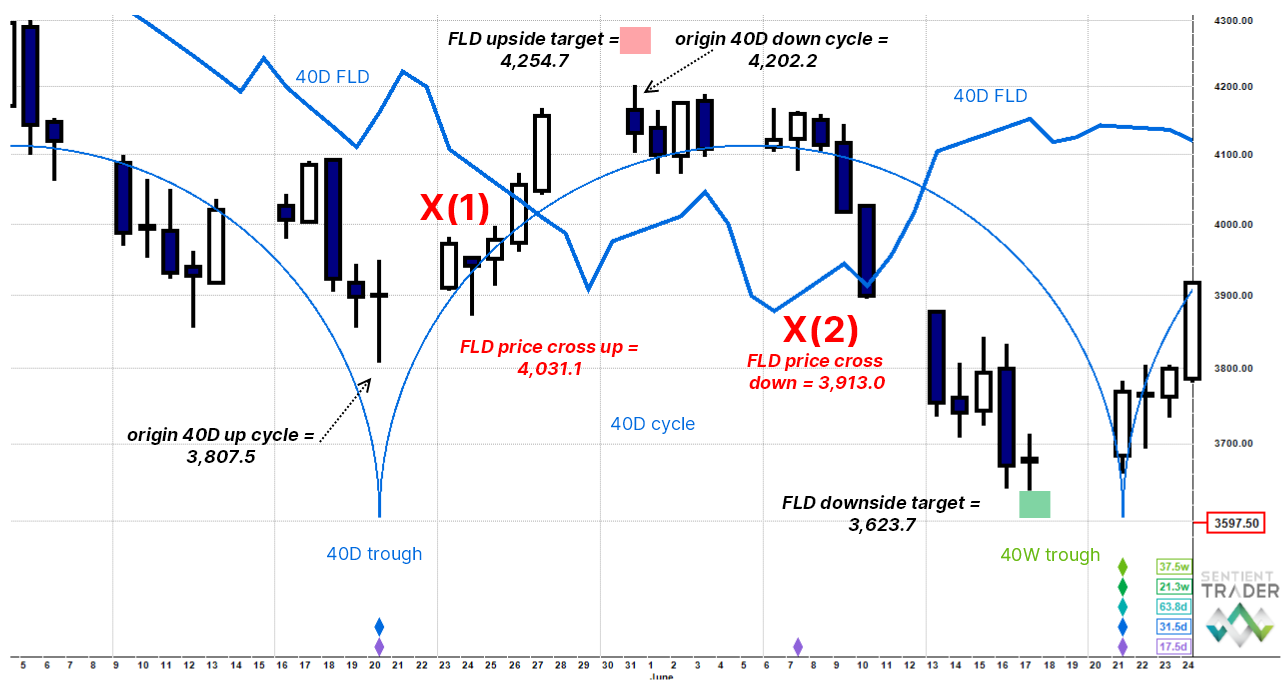
The origin price of the 40 day cycle is the same as that of the first 20 day cycle at 3,807.5. Price rallies and crosses the falling 40 day FLD at 4,031.5 X(1) generating an upside target estimate of 4,254.7. This is undershot by 52 points, again because longer cycles are pressing price down into an upcoming 40 week cycle trough.
For the downside leg the origin remains the same as for the 20 day cycle at 4,202.2 and price declines to meet the rising 40 day FLD at 3,913.0 X(2) providing a downside target estimate of 3,623.7. The actual 40 week cycle trough came in at 3,661,5.
Summary
- FLDs are replica cycles that help the analyst estimate targets as well work out the magnitude or recent peaks and troughs
- Theoretically when prices crosses up through a falling FLD, we are halfway to the peak
- .. and when prices crosses down through a rising FLD, we are halfway to the trough
- The influence of longer cycles on a cycle of interest can mean that price either undershoots or overshoots the theoretical target, which provides us with useful information about underlying trend strength and direction


%20Help%20Estimate%20Price%20Targets)