Table of Contents
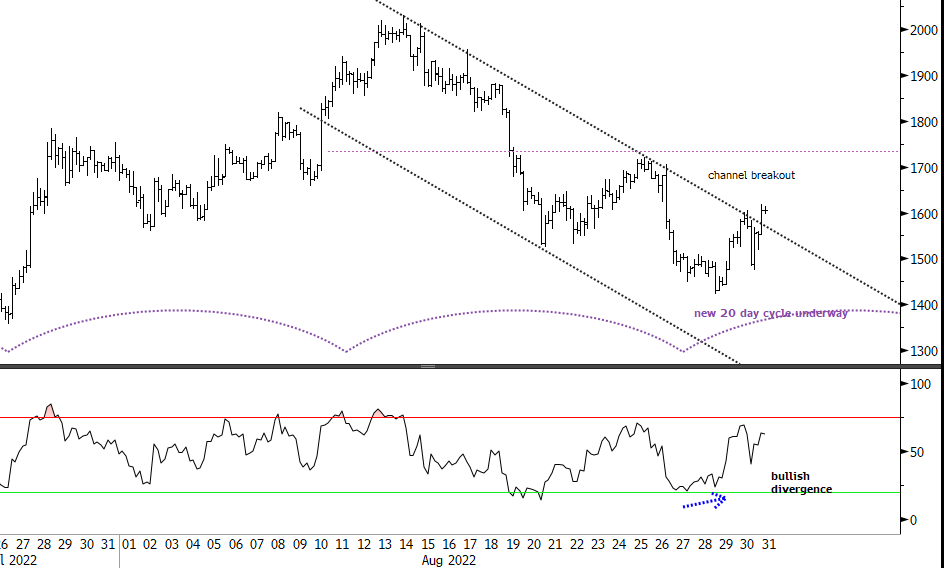
Ethereum’s 240-minute chart shows that price has just broken free of the mid-August down channel and very likely a new 20-day cycle is now underway.
This cycle is only three days old and its directional status therefore is upward.
Notice in the chart that I have plotted two semicircles representing the 20-day cycle (starting 26 July at the left of the chart) the way cycles work is that there are two 20-day cycles in a 40-day cycle, which strongly suggests that the trough on 28 August was also that of the 40-day cycle. What this means is that because the magnitude is higher the power (amplitude of the cycle) in theory should be greater.
However there is something else to consider an even longer cycle, the 80-day is falling and as such is acting as a headwind. So to make it simple, we have shorter cycles pushing up into a longer cycle pushing down and not due to bottom until mid-September.
The preferred view is a move perhaps to around US$1,750, then a sharp pullback after which the expectation is for a more sustained advance when the new 80-day cycle kicks in.