
Table of Contents
This is the fifth lesson in the study notes series. Previous notes have covered Elliott Wave, RSI and MACD.
Bollinger Bands measure volatility and are simply two bands plotted above and below a moving average and set a distance n standard deviations away. The standard setting in most software is 20,2,2. This means a 20 day moving average with the upper band set two standard deviations above the MA and the lower band two standard deviations below.
You can adjust the moving average to fit the dominant cycle on your trading horizon. Typically it should be 25% to 50% of the length of the cycle to capture the fluctuation.
Bollinger Bands widen in a fast or trending market and narrow when the market is quiet. Price also interacts with the bands and in certain configurations you can use them in a number of different ways to assess trend strength, whether an instrument is likely to reverse or pullback and to assess whether something is about to explode higher or lower.
In my experience, Bollinger Bands are best used in conjunction with other indicators (for example RSI) to add a level of detail and help make an assessment of probable outcome at the right edge of the chart.
The basic signals:
- Band tag
- Outside – Inside
- Running along
- Squeeze
Band tag
Price moves across the bands and tags either the upper or lower band and then reverses back. This method is best not used when the market is trending hard and the bands have ballooned out. In a range trading market, when price hits one of the bands it is two standard deviations away and statistically extended and more likely to mean revert (return to the moving average and thence potentially to the opposite band). In this sense you can roughly approximate to overbought or oversold.
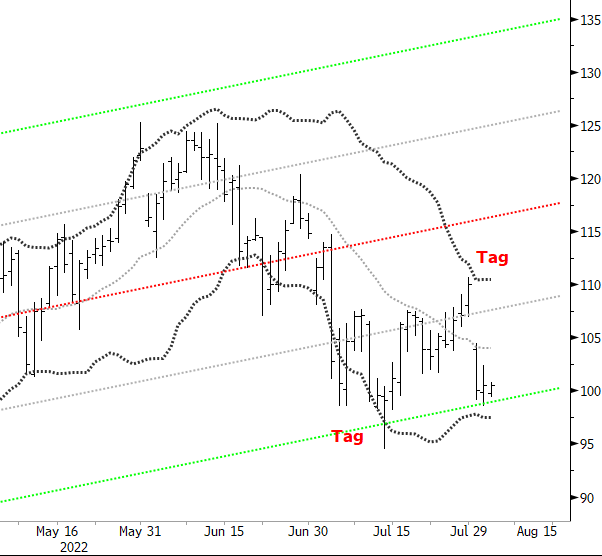
Figure 1 shows two band tags. In mid-July price tags the lower band, but does not close below it (only the days low penetrates the band). Price then retreats back up to the moving average, fails to breach it at the first test, but then goes on to tag the upper band at the end of July. Notice that price does not quite reach the upper band, so it’s a partial tag and a sign of potential weakness.
Price then more or less collapses back across the bands and at the right edge of the chart is attempting to tag the lower band. In real time each tag would be a warning to close out or even reverse your position.
Outside-Inside
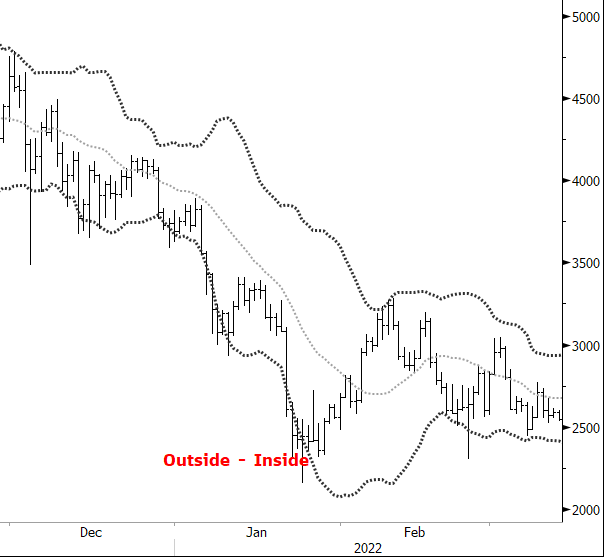
This is similar to a tag, but has more conviction. In Figure 2, price falls hard into the last week of January 2022, tests the lower band with a close outside but then on the next bar, closes inside. Price then reverses powerfully back across the bands and until the tag of the upper band creates a very profitable trade.
Running along
In a fast or trending market band width expands and price tends to run along the upper band in an uptrend or the lower band in a downtrend. Figure 3 shows price hugging the underside of the upper band, which is pointing up and notice that it’s not until mid-February that we actually see a close above the upper band, followed by an inside day and a sharper pullback.
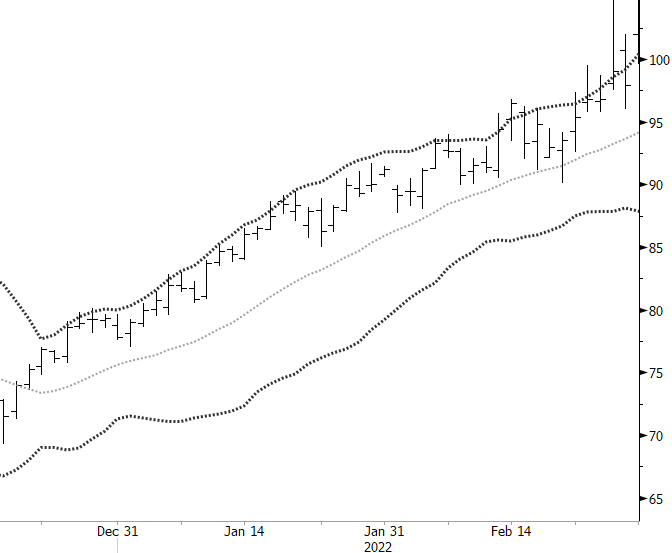
Before then price remained mostly just below the band and pullbacks where shallow and failed to even reach the moving average. This environment encourages you to remain positioned with the trend and is not the time to be looking for mean reversion trades.
Squeeze
This is where the bands significantly narrow in a low volatility environment. Low volatility tends to be a lead indicator for high volatility and you are stalking an explosive break out of the bands.
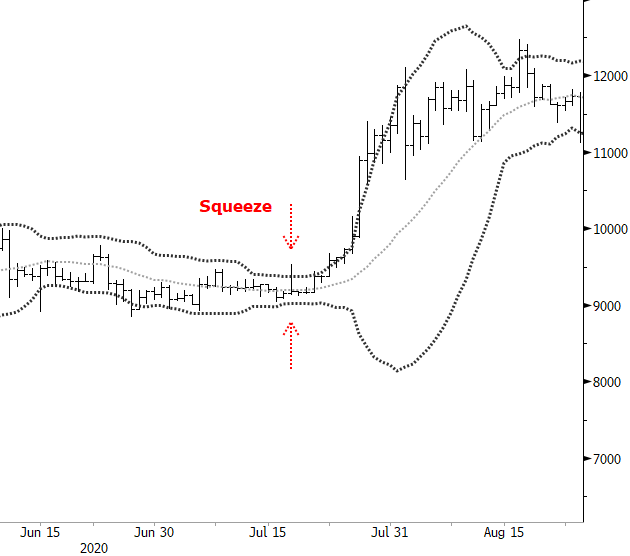
Typically the breakout tends to occur in the same direction as the trend phase running into the squeeze, but the best signal is to wait for a close outside the band. Whatever direction that is should be the direction of the breakout. Figure 4 shows a substantial narrowing of the bands into mid-July 2020 followed by a strong uptrend regime.


