Table of Contents
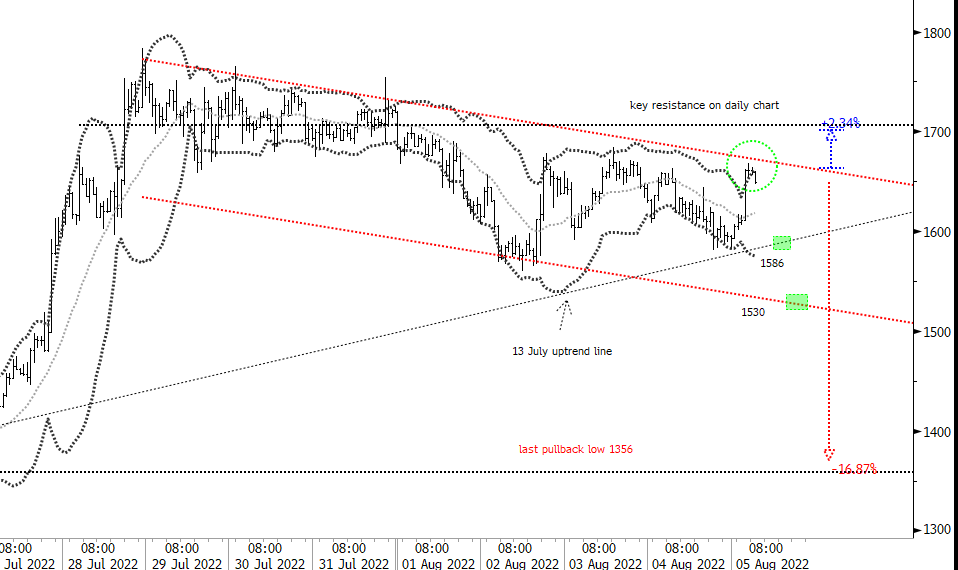
The hourly chart shows Ethereum having bounced sharply off the uptrend support line from 13 July. I have put here two cases: a continuation to natural resistance at US$1,706 (where price skidded along from mid-May and then broke down from on 11 June) which is a mere 2.3% higher. Or a drop of 17% to the last proper pullback on the daily chart at US$1,706. I am arguing for a pullback consistent with my recent notes.
Price has attempted to test the 28 July downtrend channel and just failed short of it. I have green circled the zone because it’s a Bollinger band outside inside session (see study notes on Sunday for more on the topic). Thus far then, this marks an exhaustion failure at two standard deviations out from the 20 moving average.
Downside levels to watch as breakdown continues are 13 July uptrend “support” line around US$1,586 and below US$1,530, the down channel lower boundary.