Table of Contents
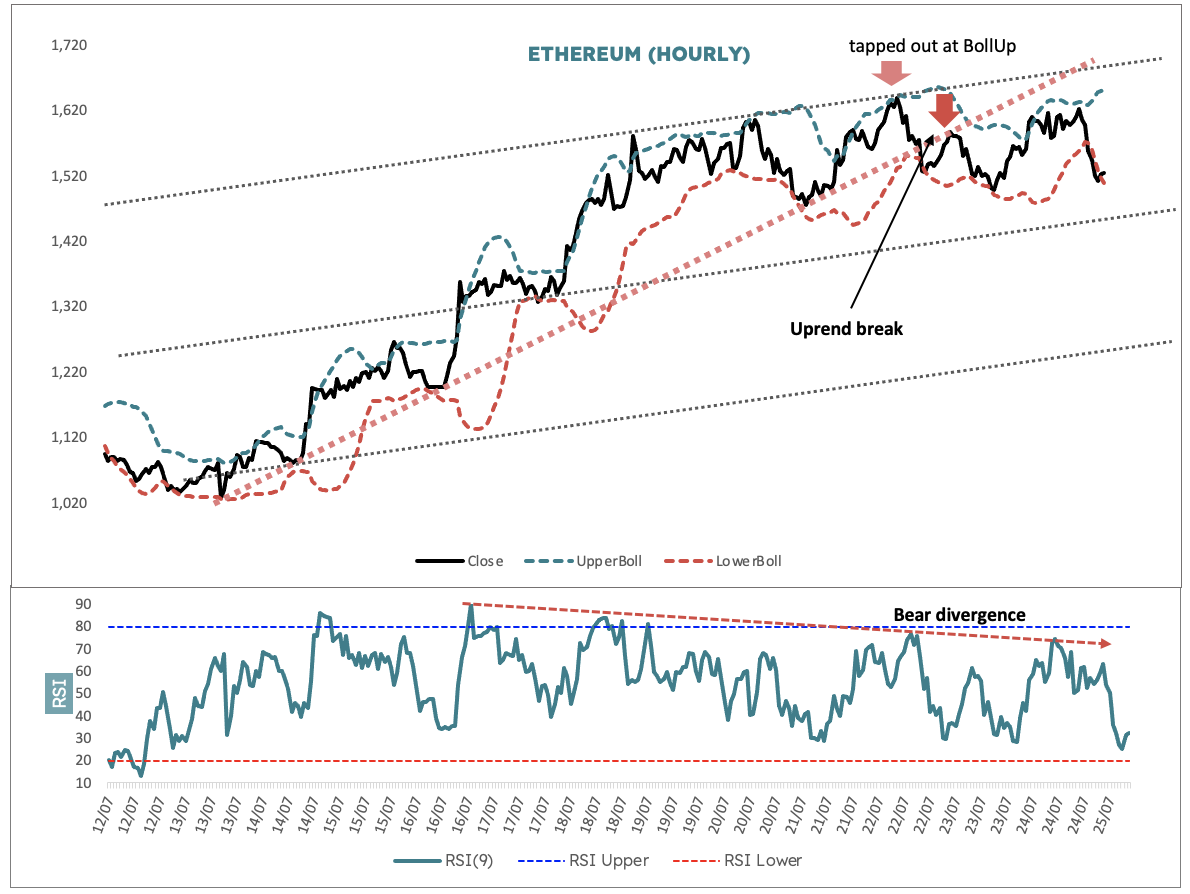
I’m looking at Ethereum’s hourly chart from 13 July, covering the recent punchy rally of nearly 60% and apparent a top out is currently underway.
I have added Bollinger bands, which I will cover in the next teaching note. Basically, these are bands set at two standard deviations above and below the 20 period moving average. As the moving average fluctuates, so do the bands.. They help us see where price is overextended in each direction.
On 22 July, price tapped at the upper band and then again yesterday, which was actually lower down. Also on 22 July, a few hours later price, broke the uptrend and the next day retested it from below and failed.
The sloping lines on the chart mark the regression channel from 18 June. Note that price has very recently been testing the upper zone and not quite making it. This has become more pronounced now and from 16 July all the way until yesterday RSI has been steadily declining putting in lower peaks.
Read more: Blocksmith Explains: More About Relative Strength Index (RSI)
This means that upside power is waning. The middle of the channel is around US$1,460. So what we are looking for now price to start slipping down along the lower Bollinger band and then for a breach of the channel midline.
Preferred view is that crypto has cracked along with Nasdaq futures and the price path is down.