
Table of Contents
Note: The teaching series, spread over 12 monthly articles, aims to provide a basic to intermediate understanding on a range of topics, including momentum, volatility, moving averages, basic patterns, cycles and the Elliott Wave Theory.
Elliott Wave Theory (EWT) is a big subject and so these study notes are but a brief introduction to help pique your interest and get you started. EWT should be seen as a framework rather than set in stone. It provides probabilistic outcomes, sometimes very high conviction, but oftentimes not. Because there are frequently alternative views and interpretations, EWT should be used in conjunction with other forms of technical analysis. This will help you zero in on the most likely set ups within the EWT framework.
The best primer on this subject, I believe, is The Elliott Wave Principle, by Robert Prechter, first published in 1978. It’s a low cost, slim volume and a thorough understanding of the book will help you draw back the curtain on how market prices actually move.
The original work on the Wave Principle was written by R.M. Elliott back in 1938, in which he basically explained that markets are neither random nor unpredictable, but rather follow principles that can be found in many if not most naturally occurring phenomena. Elliott expanded on this work in 1946 with Nature’s Law – The Secret of the Universe. A grand title is it not and it applies the theory to collective human behaviour. Incidentally, the first book Elliott ever wrote was on how to successfully manage a cafe! So he came along a bit in the intervening years.
Recurring patterns
The essential idea is that markets move in recurring patterns of waves based on investor psychology. These waves can be defined as impulsive (moving in line with the trend at a higher degree of magnitude) or corrective (moving against that trend).
There is often, but not always, a balancing in these main waves based on the Fibonacci sequence. I won’t go into the maths of this in detail, you can easily look it up on the internet and its covered well in Prechter’s book, but the key to it all is this: over a long enough set of Fibonacci numbers the ratio between any two adjacent numbers in the sequence approximates to 0.62, the so called Golden Ratio. This ratio is commonly seen in nature’s patterns and can be thought of as roughly five steps forward and three steps back. It seems that this is the most mathematically efficient path that still allows for forward motion or growth.
The basic patterns:
- Impulse waves
- Sharp corrections
- Triangles
Impulse wave
An entire impulse wave is labelled from 1 to 5 and goes either up or down. It works like this for an advance (and precisely the same, but in reverse for a decline): a price decline ends and an upside reversal takes place. The first move is typically a sharp jolt higher. Sellers are exhausted and move aside as buyers step in. Short covering adds fuel to the fire and a high momentum move to the upside begins. This is Wave 1 up.
At some stage, price rises sufficiently for would be sellers to step in and unload the positions they were caught holding while the market was still falling. They see their chance because they are still bearish. This sets off another – usually sharp – drop, but importantly price does not reach the ultimate low of the previous decline and stops short, this is Wave 2 down. This sharp up and sharp down sequence can be thought of as the base for the big move that’s coming, the Wave 3 up.
Price takes off from the bottom of Wave 2 into the technically strongest and usually longest move in the 5 Wave sequence. During Wave 3, momentum and volume are at their strongest. The top of Wave 1 is taken out, price continues higher and then passes through the so called “point of recognition” where anyone who was a seller can no longer reasonably hold onto their view as the market becomes a one way bet to the upside. At some stage though, the market becomes overbought and the urgency of buyers diminishes. Price languishes as sellers nibble, then buyers nibble at the dips and so on. And so begins Wave 4.
This wave is usually a straggling, sideways affair that just meanders along seemingly randomly. Sometimes however it’s a sharp retracement. Note here that if Wave 2 is sharp, then Wave 4 is typically flat and vice-versa. Would be buyers want to get the party started again, would be sellers who think the move was overdone are cautiously negative. The Wave 4 can be thought of as a “surprise disappointment”. At some stage however, the consolidation phase ends and the market rips higher again in the final Wave 5 burst.
Wave 5 often moves swiftly, but there is a kind of hang over, flying on fumes feel to them. Momentum and participation (volume) are usually weaker than during Wave 3 and eventually Wave 5 ends. Then comes the big correction down, but we will get to that in a moment. It’s important to note that Waves 1, 3 and 5 are so called motive waves (in the main direction of travel) and Waves 2 and 4 are corrective. If there is any overlap between the motive and corrective phases then its not an impulse move. That’s not a loose guideline, its a set in stone rule – impulse waves are swift, non overlapping and break down into five distinct sections and Wave 3s are powerful and easy to spot.
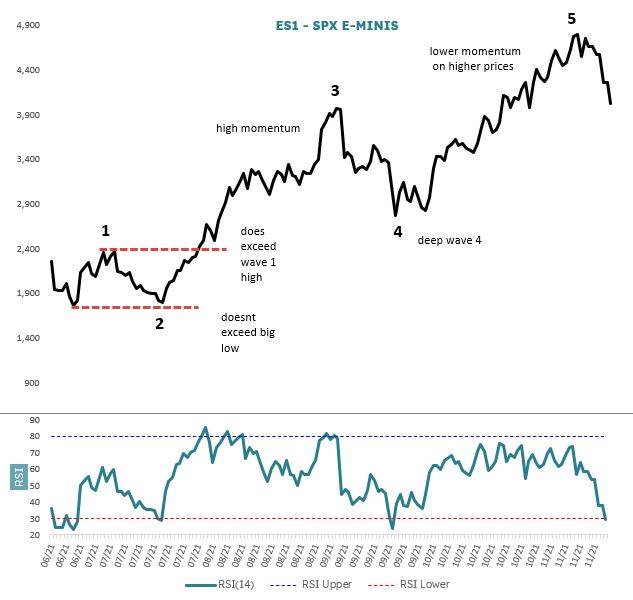
Figure 1 shows an impulse wave up in S&P 500 futures (ES1) from June 26 to 9 November 2021 basis daily line chart. Note that the Wave 4 was steep down in this case, but the Wave 3 preceding it is clear in its strength, length and purpose. Note also that although Wave 5 pushed much higher than Wave 3 it was on notably weaker momentum.
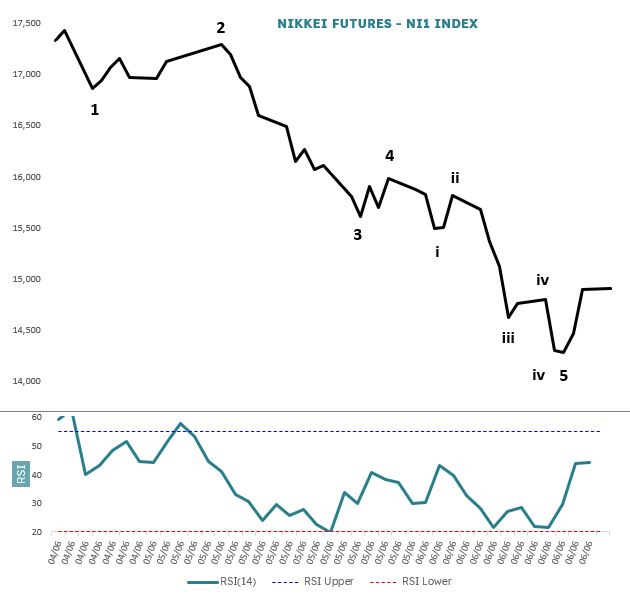
Figure 2 shows an impulse wave down in Nikkei futures from early April to mid June 2006. Notice that I have further subdivided the last wave down in a smaller degree 1 to 5 (i to v). This is because all impulse waves subdivide down into smaller and smaller impulse waves. This is called fractality: price action is self similar at all degrees of magnitude. This is a fancy way of saying that if you did not have a date line, then you would be hard pushed to distinguish a monthly bar chart from a one minute bar chart.
Sharp corrections
When an impulse wave is complete a countertrend wave follows in the opposite direction. These can come in a few shapes and sizes, but there is a common theme. In Elliott Wave spotting what could constitute a correction versus an impulse wave is something called “right look” and its a good thing for a technician to grasp. In other words, because markets are governed by pattern and form, use your eyes to take in the shape of thing first. Sharp corrections just look different.
Firstly overall they tend not to not to flow freely in a non overlapping manner and they unfold in three main sections not five. There tends to be a “divided in the middle” look to them. And whereas impulse moves are labelled 1 to 5, sharp corrections are assigned letters A, B, C. Note: more complex corrections can be labelled X, Y, Z or variations thereon, but the message is the same: it’s not impulsive. We could go into common concepts like they retrace 62% or 38% of the previous impulse move and sometimes they do, but mostly I have found they do not. Try not to be too dogmatic with EWT, you are looking for overall feel.
The pattern could broadly described as some sort of zigzag, but in strict Elliott Wave speak its a species of sharp correction called a Running Flat. There are four main sharp corrections, they each have minor variations, but they all form in three main waves: the Zigzag, the Flat, the Expanded Flat and the Running Flat. Prechter’s book covers them in detail, but for the purpose of this lesson it’s sufficient to note that they are the opposite of Impulse waves which have 5 non overlapping sections.
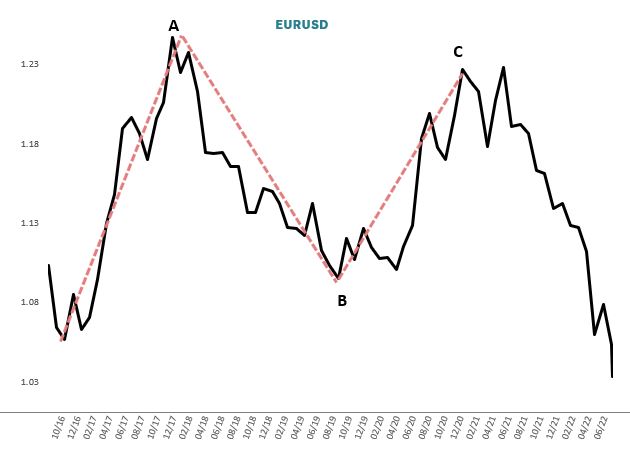
Figure 3 is the Euro vs US Dollar basis monthly data and the corrective ABC pattern plays out from December 2016 to December 2020. The first thing to note is that there is a clear divided in the middle overlap look and that it has three waves rather than five. So immediately it is classified as a correction. The immediate question then is: what is it correcting? And that would be the long drawn out price decline from March 2008 (not shown). If it is a correction then it is moving against the longer trend (which is down) and is therefore a multi year rest phase. And as you can see as soon a the final Wave C up ends, the downtrend resumes in force.
The pattern could broadly described as some sort of zigzag, but in strict Elliott Wave speak its a species of sharp correction called a Running Flat. There are four main sharp corrections, they each have minor variations, but they all form in three main waves: the Zigzag, the Flat, the Expanded Flat and the Running Flat. Prechter’s book covers them in detail, but for the purpose of this lesson it’s sufficient to note that they are the opposite of Impulse waves which have 5 non overlapping sections.
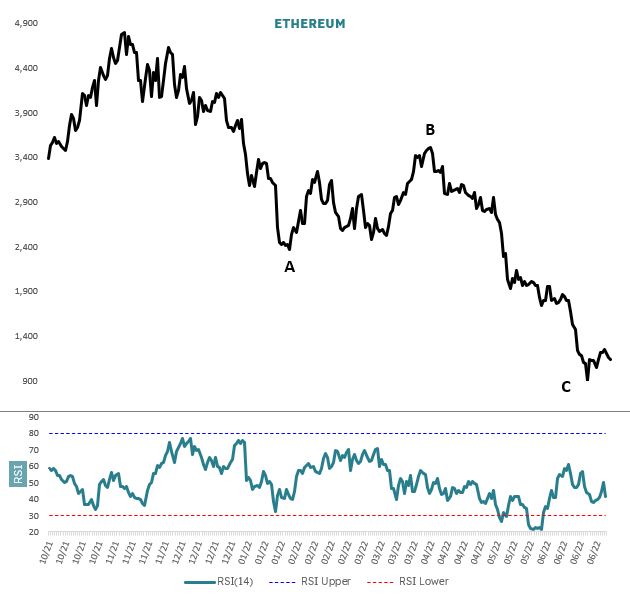
Figure 4 shows Ethereum vs US dollar from October 2021 to June 2022. This is a classic zigzag so far: a sharp impulsive move up – Wave A; a straggly, steep corrective wave down – B; followed by a sharp impulsive Wave C up. Again we have three main sections which makes it (so far) not impulsive overall. However note, that within different legs of corrections the are one or two legs which are impulsive: its the overall form you are interested in here.
Triangles
Triangles are a corrective pattern and mainly occur in the Wave B or Wave 4 positions. The move out of them is always in the same direction as the move in and they are always the penultimate move in a longer set up. Like all corrections they comprise of 3 wave moves, but the big difference here is that its always five 3 wave moves for a triangle. And as for other corrections the convention is to label them with letters rather than numbers, which are only used for impulse waves. Triangles can be tricky to spot
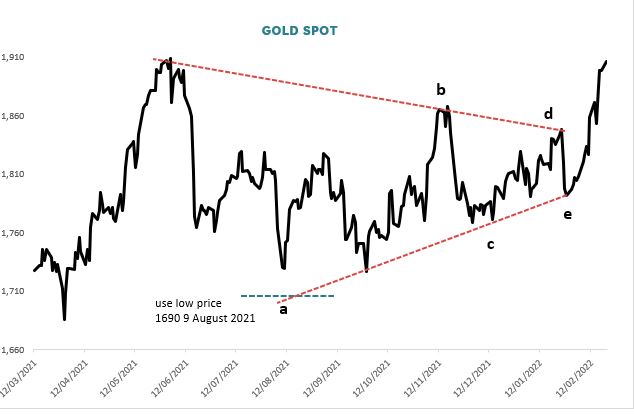
Figure 5 shows a triangle in the B wave in Gold spot (XAU) from March 2021 to January 2021. The net direction of travel is sideways. I have used a line chart to make it simpler but the first A wave down actually ends at the price low of 1,690 on 9 August 2021. Notice it has that divided in the middle effect of a three wave move. Then a 3 wave B move up, the C wave down, D wave up and final E wave down. Each segment has three waves and the overall pattern within converging lines forms the ABCDE triangle. After the E wave came the final big push out. There are some further final rules around triangles and they are explained in detail in Prechter’s text.
Summary
We have covered three main formations within EWT: the impulse move, the sharp correction and the triangle. There is a lot more to the subject, but this is a basic start. The impulse wave is swift, non overlapping and consists of five waves: two against the main trend, three in the same direction. Corrections are three waves.
Overall I think that if you don’t really have a clue whats going on then the market is probably in a corrective phase. These can take their own sweet time to mature and often weave around a bit morphing into more complex three wave structures. Corrections are a time for patience. Although with that said if you are eager to trade, drop down a timeframe or two and look for the shorter timeframe Wave 3 impulse moves within the broader corrections.
Elliott Wave can be mastered in time and although there are rules and guidelines its more art than science. Not every wave pattern offers a lay up trade, but there are certain points which are very high probability trades. Wave 3 when it passes through the top of prior Wave 1; Wave 5 or Wave C out of a triangle and so on. Best is to have a rough idea in terms of the Elliott Wave grid reference as to where you are on the map and choose what trades to take with patience.


