Table of Contents
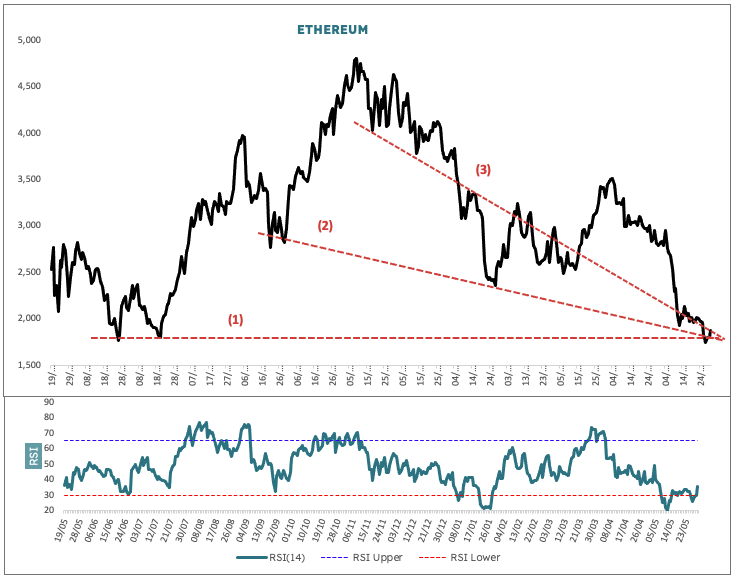
The chart goes back to May 2021. The price of Ethereum has landed at the double bottom on the close around US$1,780 from 26 June to 20 July (1). It has also intersected with a long internal trendline from 22 September 2021 (2) and finally with another internal trendline from mid November 2021 (3). Notice how these three lines converge on each other in a uniform manner.
The market is trying to tell us something.
At the same time, RSI has put in an obvious bullish divergence (marked by the thick black arrow in the subwindow). You may recall from the first RSI teaching note that this indicates a sudden stall out in a big decline: price swings lower while RSI swings higher. The takeaway from this signal is that an upside reversal may be setting up.
Read more: Blocksmith Explains Relative Strength Index (RSI)
Looking across the Ethereum vs Bitcoin, Ethereum has underperformed Bitcoin by 22% since mid-April and is currently trading at 0.061 – priced off last Friday’s close. At the same time, we are still a little above a key support zone. So it’s too soon to say whether Ethereum starts outperforming again as it last did for a month from the first week of March.
You may remember that in multiple previous notes we have been looking at the very tight positive correlation between S&P500 Index futures (ES1 Index) and crypto. The longer term average was nearly +0.9.
Well here is an interesting development, designed to fox anyone who thinks they have found a meaningful relationship between two sets of data: the correlation between Ethereum and ES1 Index since 20 May is minus 0.95! In other words yesterday Ethereum had completely decoupled for now. ES1 rallied hard, Ethereum fell hard.
Read more: Blocksmith Says Look to S&P Index Futures to Understand BTC Action
Watching current breakout with interest for longevity.