Table of Contents
Yesterday we looked across at the S&P 500 Index and it was noted that there looks to be potential for an inflection higher (i.e. a return to risk on). With such a close positive correlation to bitcoin (+0.86), the read through is a potential uplift in crypto with the broad US market.
Read more: Blocksmith Says: Look to S&P Index Futures to Understand BTC Action
Today I thought it would be prudent to run a quick read across to US sovereign debt yields and the standard is the 10 year.
At the moment, the market is looking keenly at the US Federal Reserve’s rate hike cycle. Higher rates to tackle inflation (some 8.3% for the 12 months into April 2022) mean higher US sovereign debt yields, which is negative for equities here and, by extension, for crypto also.
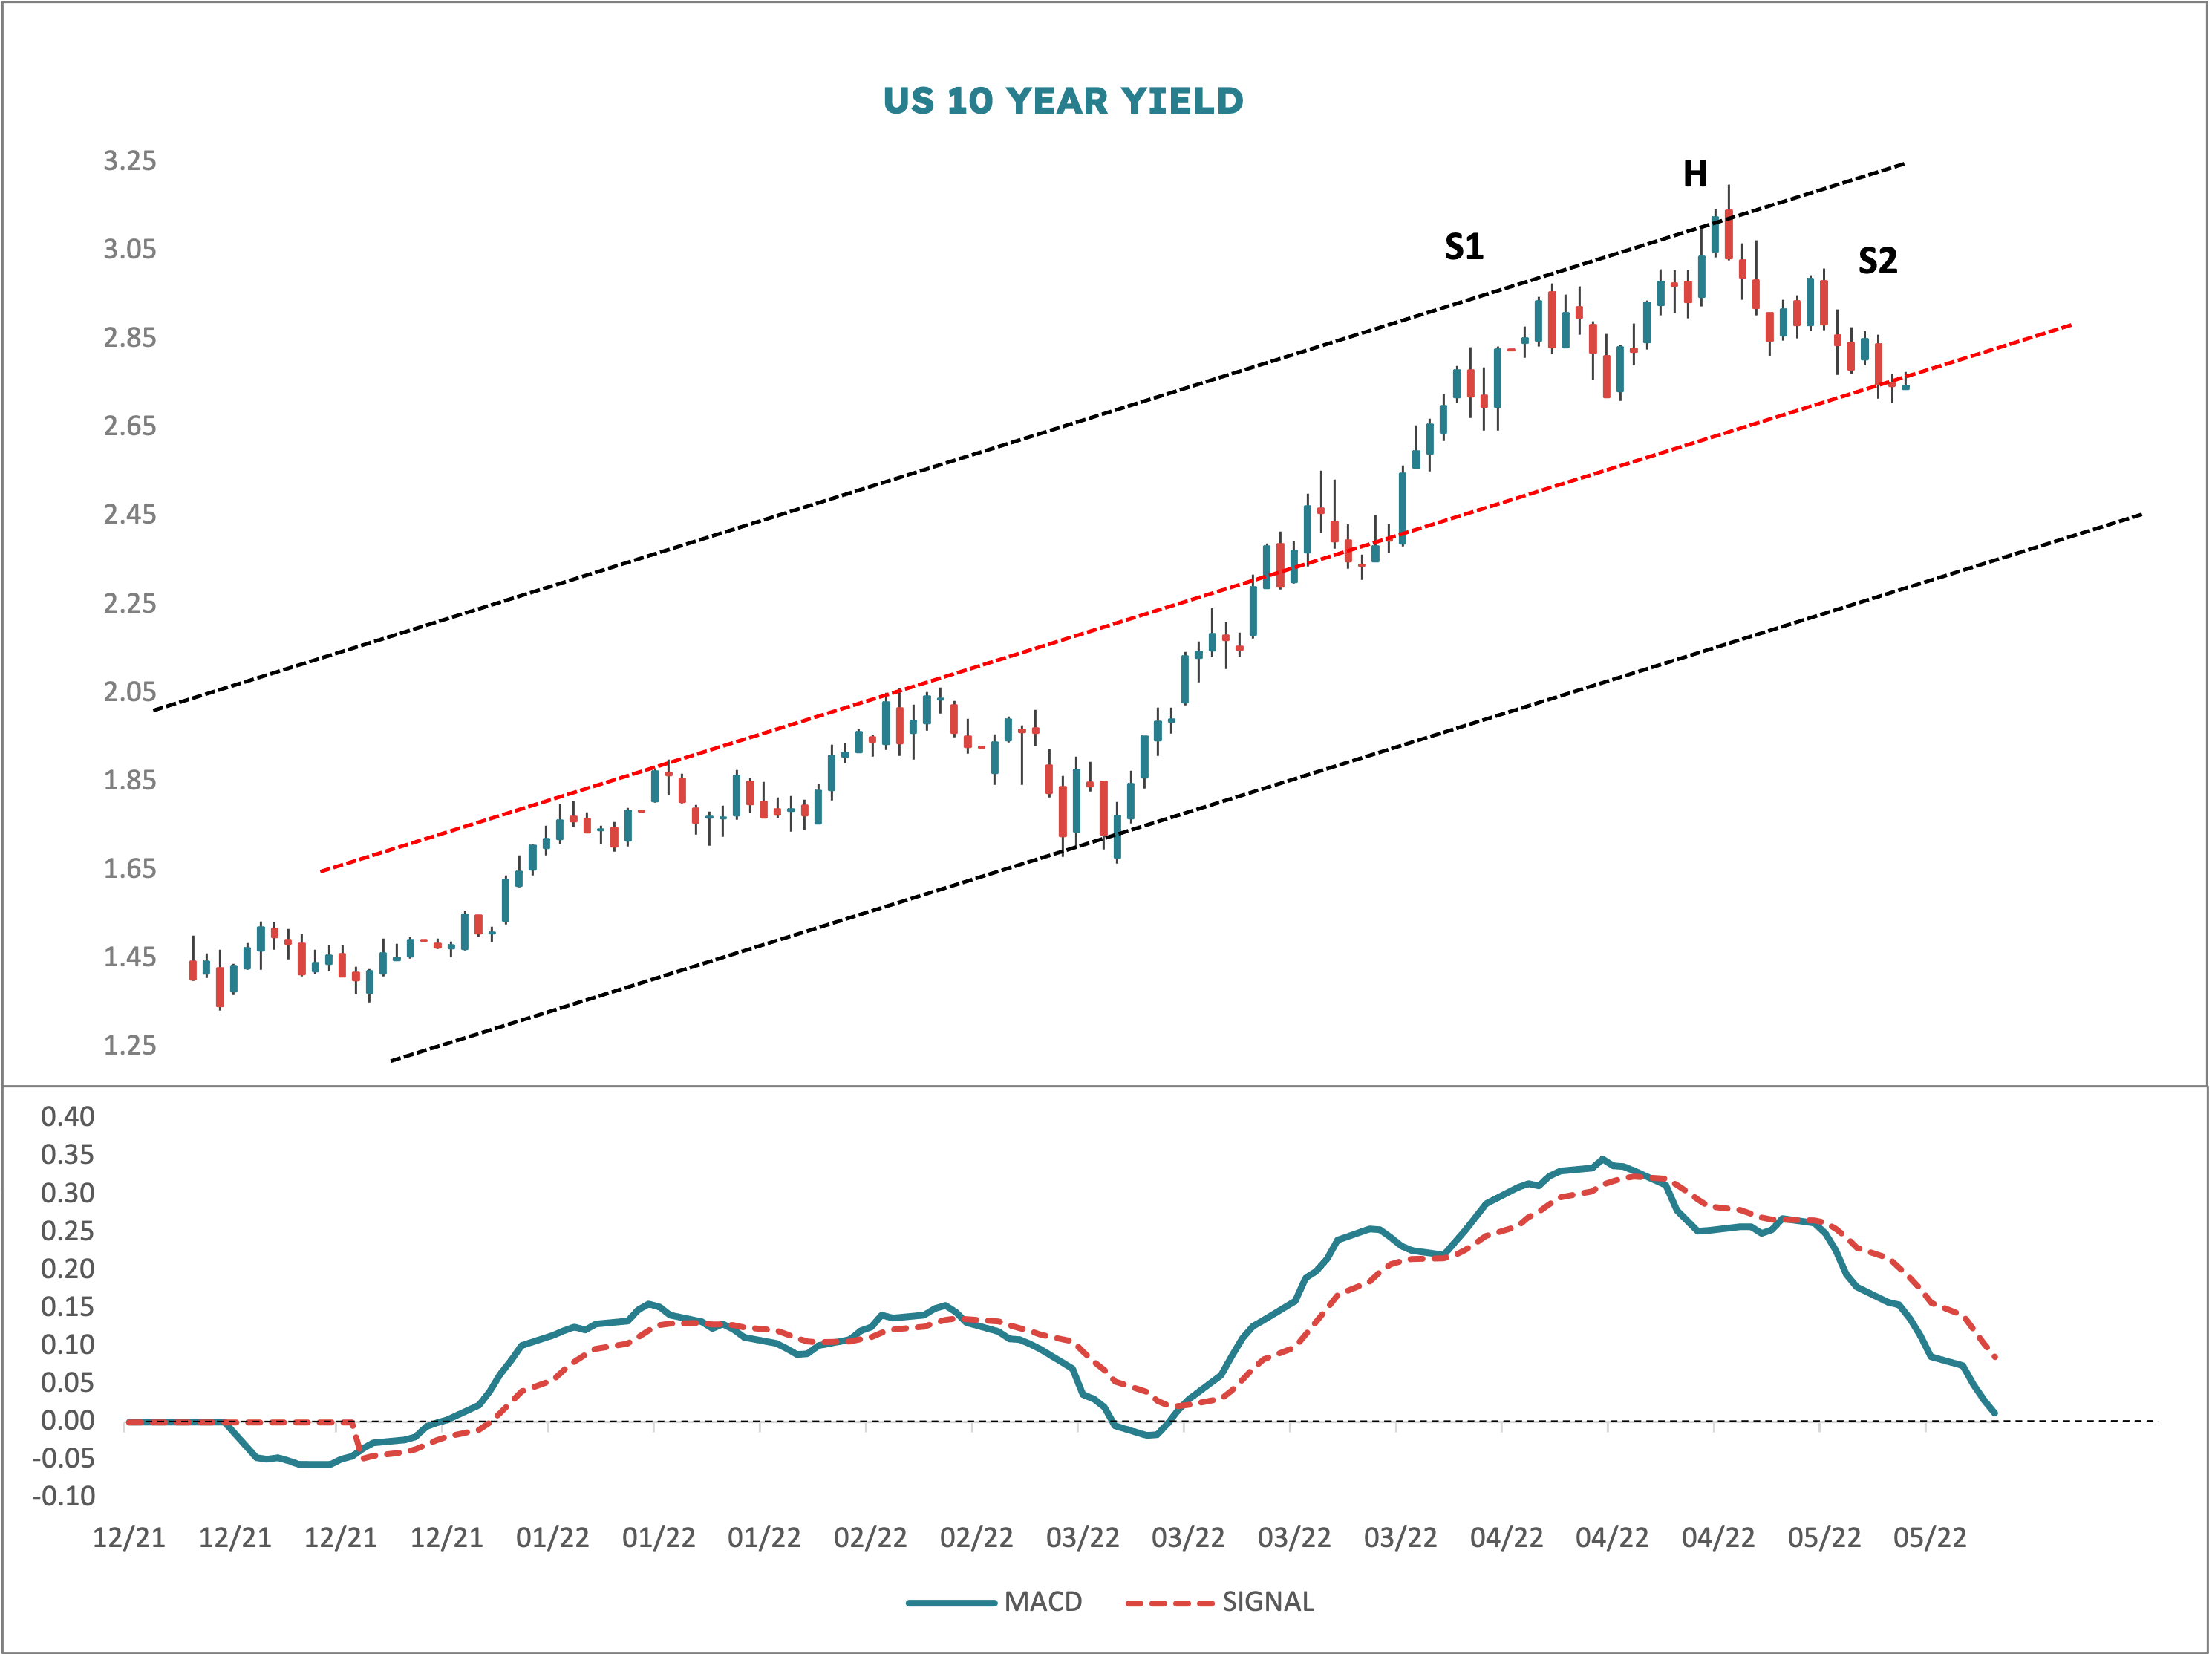
The chart shows the 10 year across 2022. We reached a peak of 3.13 in early May and since then there has been a decline to the current value of 2.73. The channel lines plotted are a regression analysis from the August 2021 low.
We use these to capture the centre of the data (the red mean line) which is currently being crossed to the downside. The upper and lower lines are two standard errors (basically standard deviation) away from the centreline. This shows overextension in either direction. Notice that a textbook head and shoulders top has formed into the upper channel line. This points to more downside (lower yields, less Fed hiking).
Instead of RSI to measure momentum in the subwindow, today I am using Moving Average Convergence Divergence (MACD). We will go through this indicator in a new teaching note next week, but for now it is as well to note that a signal is about to be generated: a zero cross downwards of the blue MACD line. This conforms with the chart’s downside thesis. Thus, yields down, equities up, crypto up is the proposition.