Table of Contents
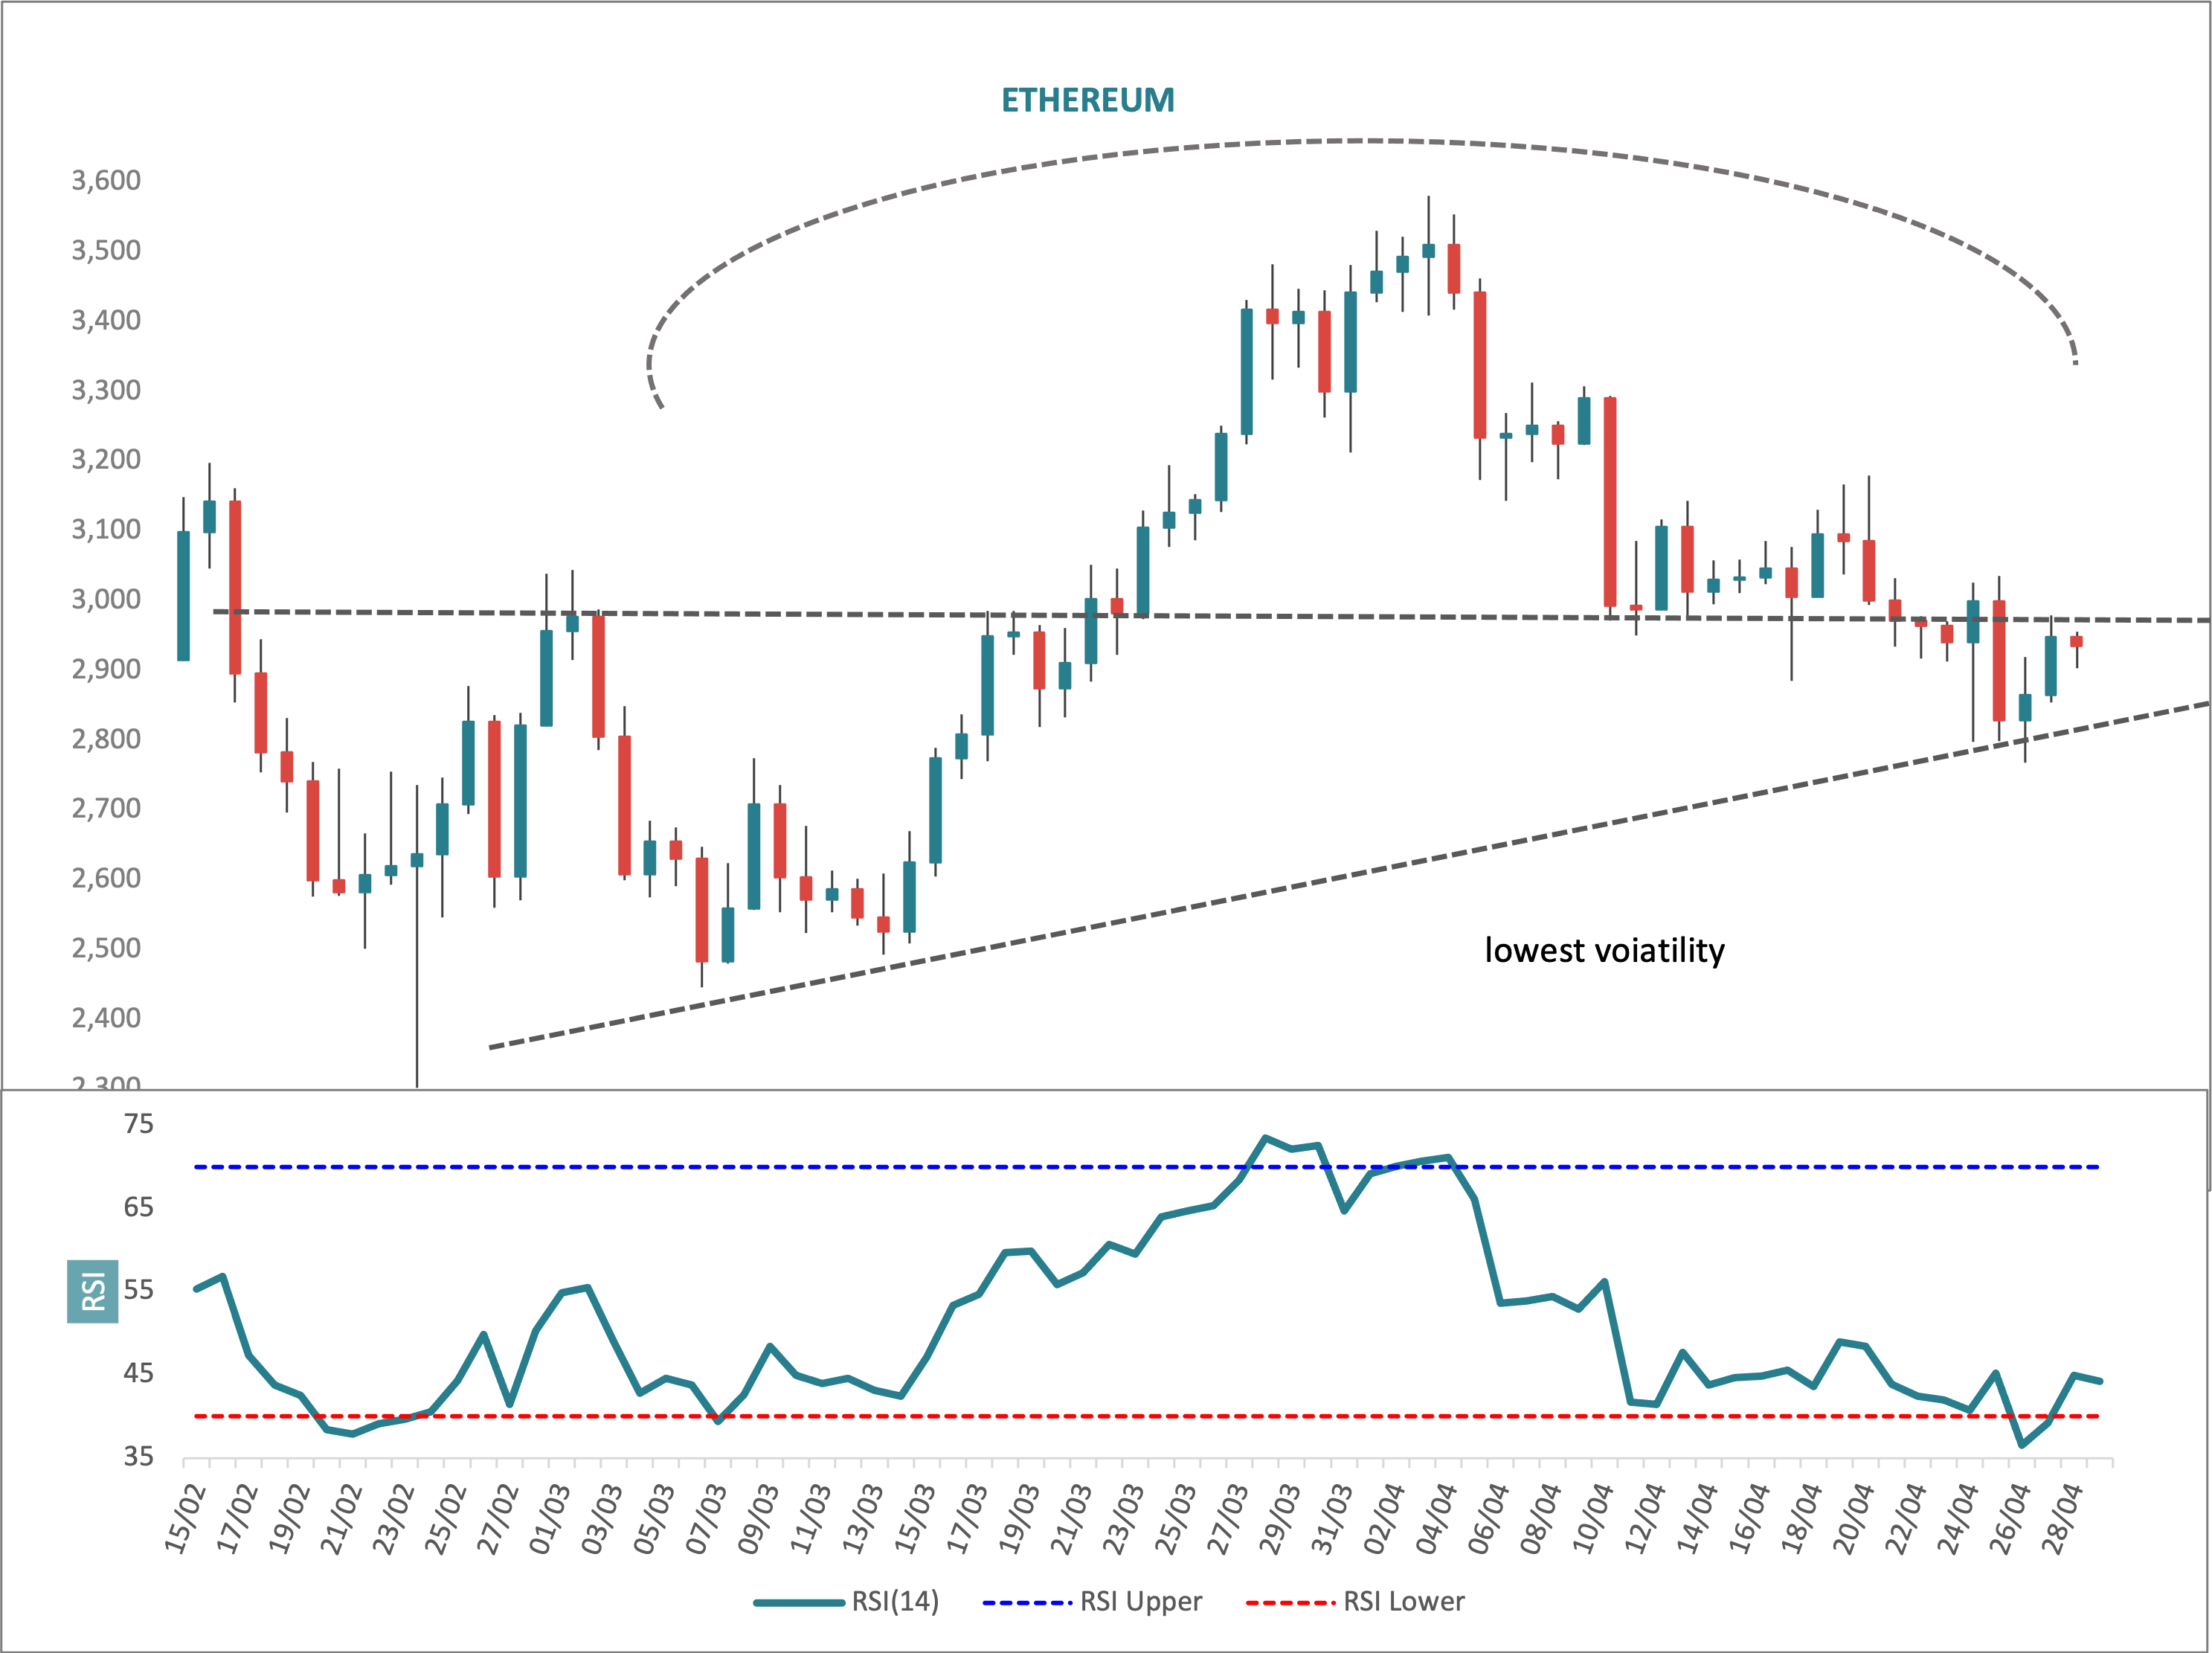
On 24 April, the lowest volatility reading in one year was recorded in Ethereum (the nine day Average True Range of the price printed 106.4). Price then dropped sharply into that uptrend support line we have been eyeing this week. At the same time, we are in a clear 40 day (and perhaps also 80 day) cycle trough zone.
In the last session, price held its ground above the trend line and is now challenging the key support resistance line at the important psychological level of 3,000. Interestingly we are also only 20 points shy of the 2,941 close of 24 April. The point being made here is that we are in a potentially important low zone that was preceded by volatility pretty much going to sleep for a session. Low volatility tends to precede high volatility and the preferred view is for this to express itself to the upside.
Note also that S&P500 Index futures also staged a bounce as did Nikkei futures which is now leading hard. Ethereum is 90% correlated to S&P500 futures this month (but only 72% correlated to Nikkei).
Prepare for potential breakout and upside reversal.