Table of Contents
Typically we have looked at the Ethereum | Bitcoin spread on short-term timeframes only, for example when a rally in crypto looked likely. We do this in order to assess which one, whether Ethereum or Bitcoin, is more likely to outperform. If the spread line is rising it means that Ethereum is outperforming and vice versa.
Interestingly the ETH | BTC spread has a positive correlation of 71% with Ethereum itself, but only 50% with Bitcoin.
On that basis one might think there was a trading system tucked away in there, for example Buy or Sell ETH based on signals in ETH | BTC. I just created a simple one to see if the idea worked, in this case a 20-day moving average crossover system. If the close in ETH | BTC is above the 20 day MA today, but was below it yesterday, then Buy. The test then was, what on average is the performance change in ETH after five sessions. The answer was +0.43%. Just trading the same system on Ethereum yielded an average of 1.60%. So basically no, it doesn’t really work.
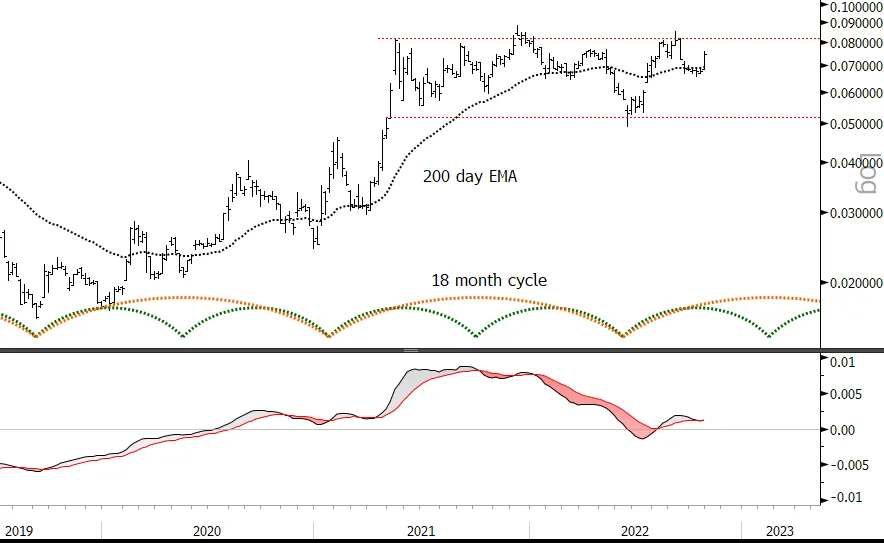
The weekly chart below has the June 2022 as an 18 month cycle trough, the cycles in the spread are super clear. The 18M is young and rising and could very well take ETH through top of the range. MACD (40,20,12) – changed settings for the 200 day MA – is inflecting up and price has lifted off smartly straight off the 40 week MA (which is the 200 day MA).


