Table of Contents
Lots of market volatility at the moment which makes it harder for traders to get a good footing. The view remains dollar down, crypto and gold up, but in the meantime the grind lower continues.
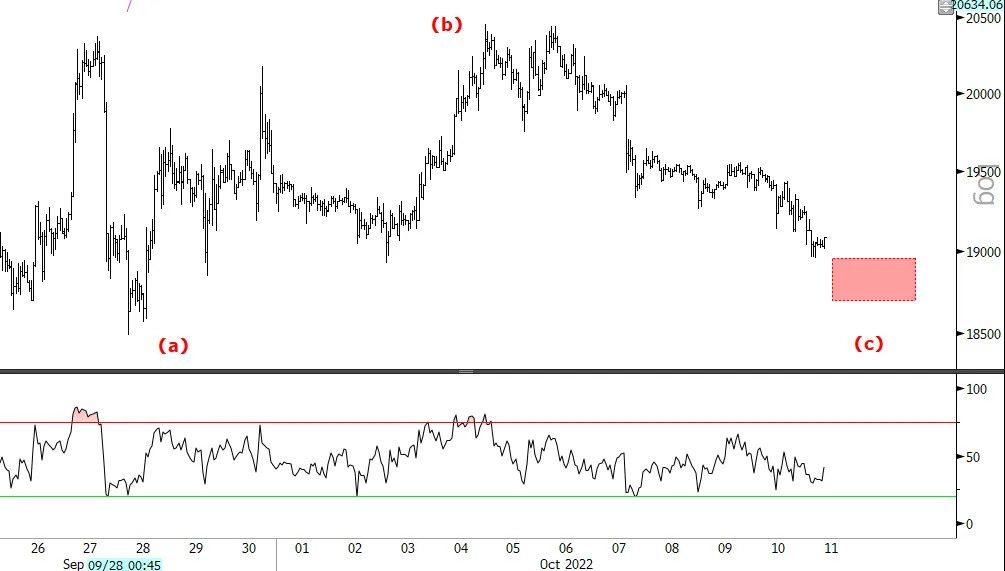
Looking at the hourly chart for Bitcoin here, there looks to be a hard floor around US$18,500 and bottom range from there up to around US$18,800.
The price structure from the end of September still looks corrective and I am seeing it as an ABC-flat. So that’s a sharp A wave down to 28 September, then a straggly wave B back up to the A wave origin on 4 October and finishes with an impulsive C wave down, which should end shortly. Usually the C wave in this particular structure ends around the same place as the A wave.


