Table of Contents
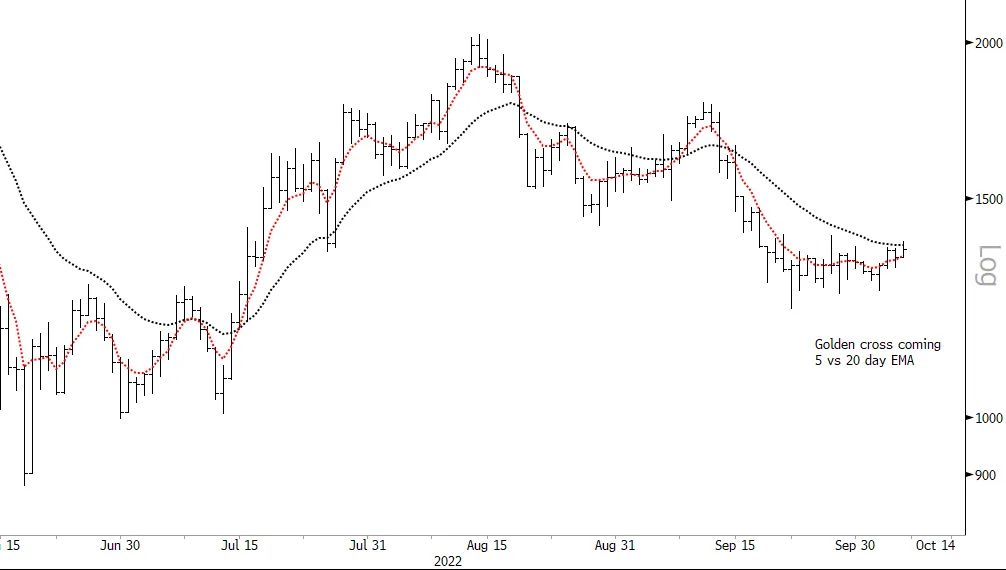
Today we are going to look at Ethereum again, but this time on the daily data level and we are going to consider an upcoming “signal.” The signal is a so-called Golden Cross and this is simply where a shorter moving average passes up through a longer moving average.
The implication is that near term trend is accelerating faster than longer term trend and its generally taken as a Buy signal. You can use pretty much any moving averages for this signal but a common set is 5 and 20. And the technical analysis textbooks everyone rushes out to buy when they decide to give up their day job and make it big as a trader tell us this is a great signal.
So is it a great signal? Well we can do a simple test. Download the open-high-low-close (OHLC) and moving average (MA) data onto an excel sheet. Sort data from oldest date to newest, create a new column and ask the MA columns this question =IF(AND(H5<G5,H6>G6),1,””) (H5 is yesterday’s 5 MA, H6 today’s; G5 is yesterday’s 20 MA, G6 today’s).. and then in a new column using the next open find out what the price change was over say 10 days whenever the signal appeared. You should find this out: that from 1 Jan 2020 (near the start of the data) and 1,006 trading days, the signal came 22 times and the average percent change was 0.33%. So in that sense it’s a winning system. kind of.
But then a bit more digging reveals that only 11 returns were positive. And yet more digging reveals that the MaxLoss was 21%. So far, not so great. And finally when you get the average return for all 10 day phases regardless of signal the return is 3.66%.
The takeaway here is: you cannot rely on moving average crossovers. I will tell you what moving averages really are about one day soon.


