Table of Contents
Yesterday we were looking at the XETXBT (Ethereum vs Bitcoin) spread, which is still falling. The absolute price of ETH here presents us with a conundrum.
Technical analysis is part art, part science. Sometimes the market presents us with crystal clear calls to action, oftentimes though it’s a bit muddled. What we are doing when we engage in technical analysis is we are trying to get a gambler’s advantage at the right edge of the chart. And then when we think we have that we pay to see if we are right or not. We are not looking for certainty, we are looking for a fair chance somewhat better than random. Then we set our entry level, place a stop, and pick a possible target. If we are right, well and good, and if not we get stopped out and live to trade another day.
Ethereum right now is one that we would be watching closely but not trying to take an aggressive view on.
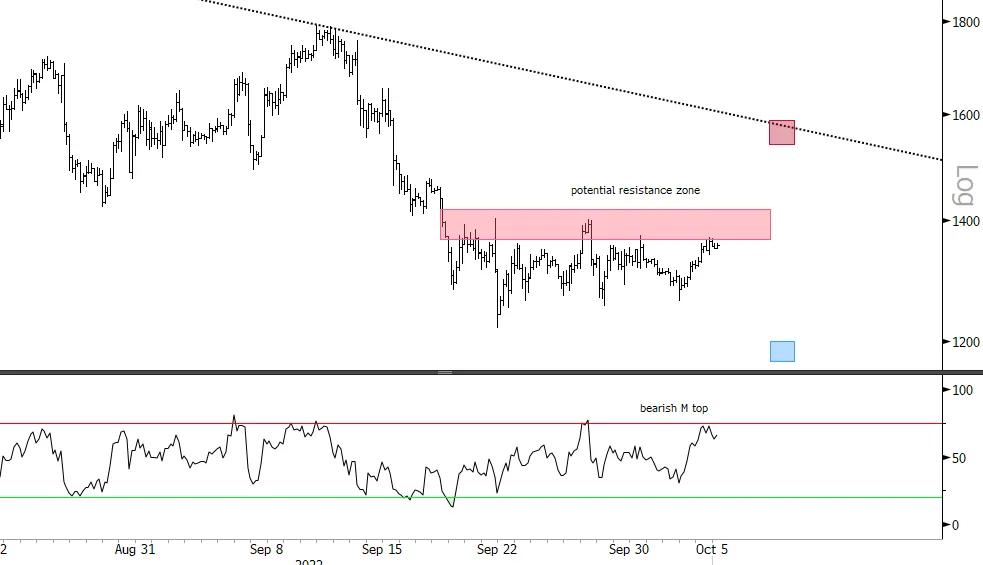
Price could either be consolidating sideways or forming a base. If it’s a consolidation, then its back down when mature (the bearish top in RSI makes this a possibility as does the resistance band above). If it’s a base then price is likely to shoot up to that downtrend return line around US$1,550 (the recent higher lows and build up in RSI power make this a possibility too).
Don’t be too quick to take action is a good rule of thumb in trading – “Waiting is Doing.” But then when you think you have an edge, don’t be soppy and hesitant, get involved and enter the market. For now reference ETH we are biding our time and seeing what the market will offer us.
Have a look at the 240 minute chart of Ethereum above.


