Table of Contents
Bitcoin was last at $79,810, maintaining its impressive upward trajectory. Earlier on Monday, it achieved an impressive $80,393, marking the cryptocurrency's all-time high since January 31, 2026.
Following a three-month period of consolidation, Bitcoin's price has successfully surpassed the $80,000 mark, driven by the latest developments, and has regained the bull market support band that had limited all recoveries since November 2025.
Asian market stock indices approached record highs, Ether also saw an upward surge.
The surge followed US President Donald Trump's announcement that the US will begin escorting commercial ships through the Strait of Hormuz and had responded to Iran's 14-point peace program.
The macroeconomic headwinds that had affected risk assets in the first quarter were alleviated as a result of this outcome, which caused US crude futures to fall by over 5%.
Technical considerations take a back seat to geopolitical ones as the primary motivators.
After Iran sent its updated proposal to Pakistani mediators on May 1, the price of Brent crude fell to $107 per barrel, the lowest it had been in four years.
The United States' reaction suggested a shift away from a full closure of the Strait of Hormuz, which had maintained high expectations for oil-linked inflation for the previous two months.
As soon as there was a change in the oil market, talks about monetary policy and risk assets resumed.
Institutional Interest Keeps Growing
The sudden uptick in interest in a Bitcoin exchange-traded fund sheds light on when the latest breakthrough occurred.
The most solid month for institutional investors since October 2025 was April, with net inflows of $2.44 billion. At the same time, tracking at the fund level shows that net inflows for May have already exceeded $629 million.
With a market share of 62% and almost 812,000 BTC in BlackRock's IBIT, cumulative net inflows since inception in January 2024 have surpassed $58.5 billion.
Over $100 million was raised in the first six trading days of Morgan Stanley's MSBT, which made its debut on April 8.
The on-chain ledger adds credibility to the flow story.
In the last 30 days, the largest single-month accumulation since 2013 has occurred in wallets holding 1,000 BTC or more, increasing their holdings by 270,000 BTC.
At the same time, currency reserves have fallen to levels not seen since December 2017, a level that is seven years lower.
Both signs point to a desire for long-term investment rather than frenzied buying and selling.
One can see the risk indicator in action with the most recent ETF transactions.
After nine days of straight inflows, April 29 saw net outflows of $89 million in IBIT, the biggest single-day sell-off of the month.
200-Day Resistance
The 200-day moving average is presently the center of attention among market players. This trend indicator takes a price snapshot over a period of around 200 days. It often acts as a substantial obstacle in recovering markets; it is now slightly over $83,000.
Past purchasers have showed interest in the $72,000 to $75,000 price bracket, so it seems like that's where the support is being laid. Imagine it as the bedrock that hopeful investors are relying on to stay put in the event that market swings flare up again.
The recent surge in Bitcoin appears promising, but we have yet to see sustained momentum. Surpassing $80K is the initial milestone — maintaining that level is what distinguishes a genuine rally from a mere false breakout.
From its 2026 low of over $62,000, reached on February 5, Bitcoin has recovered nearly 30%, regaining its way to $80,000. There is a reasonable path for Bitcoin to hit $100,000, according to several experts in the field.
The industry is also keeping a close eye on the US Bitcoin Reserve situation, particularly in light of comments made by White House crypto advisor Patrick Witt at the Bitcoin Conference in Las Vegas not long ago.
According to Witt, big news about Trump's Bitcoin reserve would be announced in the next few weeks.
Risk Positioning
The most important thing to remember for traders wasn't that the danger of Hormuz was gone. That is a categorical no.
The most important thing to remember is that after weeks of problems like shipping disruptions, rising energy risks, and uncertainty over Iran, which affected risk sentiment generally, the US statement gave markets a clear route to de-escalate.
Since the battle began, ships and their personnel have been in the Persian Gulf in a state of insecurity due to the recent events in Iran and their influence on global markets.
This movement was further amplified by the positioning in derivatives.
Data from CoinGlass shows that $356.55 million worth of crypto has been liquidated in the last 24 hours. Included in this total are $303.88 million from short liquidations and $52.66 million from long liquidations.
The heatmap showed that out of all the cryptocurrencies, Bitcoin had the largest liquidation block at $170.69 million, followed by Ethereum with $91.60 million.
As Bitcoin reached the $80,000 barrier, this is in line with a modest short squeeze: those holding bearish positions were forced to buy back into a rising market, which created more mechanical demand.
Support did not come only from the short squeeze.
Last week, spot bitcoin ETFs in the US had inflows of $153.87 million, continuing a remarkable trend, according to SoSoValue data.
This marks the fifth consecutive week of inflows. According to the flow profile, the change was caused by more than just headlines; it also showed that institutions were investing consistently after a few weeks of recovery.
According to the daily chart, Bitcoin is testing the top limit of a four-month consolidation area that starts around $75,000 and ends just below $82,000.
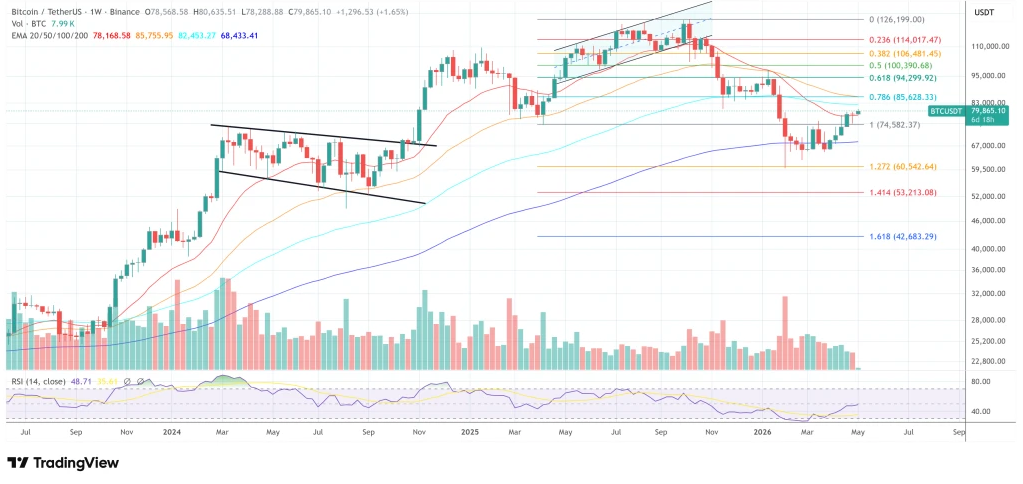
The $75,000 mark is being supported by the following: the lows from November 2025, the local top in mid-March, which is currently acting as support, and the converging upward 50-day moving average.
After finding support at roughly $78,000, the price of Bitcoin has started to increase again. With the $78,500 and $78,800 resistance levels in sight, BTC is displaying signs of momentum.
The price soared beyond $80,000 because to the strong market momentum. After reaching a high of$80,336, the market consolidated above the 23.6% Fibonacci retracement level of the price rise from the $74,940 swing low to that high.
Prices are presently rising above $78,500, indicating significant momentum in the market.
The current price of Bitcoin is more than $79,200, which is higher than the 100 hourly simple moving average. The hourly chart for the BTC/USD pair shows support near $79,000, and a bullish trend line is also appearing.
There could be a chance for a fresh upward rise if the price remains stable over $79,200.
Around $80,250 is the present level of resistance.
The next substantial hurdle is around $80,500. If the price can break past the $80,500 barrier mark, it might continue to rise.
The price might rise and test the $81,200 level of resistance in this case. If prices continue to rise, they may reach $82,000. Potentially $82,500 will be the next hurdle for the hopeful traders.
Assuming Bitcoin fails to break over the $80,500 level of resistance, it may trigger a new decline. The backing is currently nearing $79,000. The $78,250 barrier is the first major support.
Approximately $77,650 marks the halfway point of the $80,336–$74,940 upward trend, which coincides with the next support level.
The $77,000 support level may be reached in the near future if the price continues to fall.
If Bitcoin's price drops below the main support level, which is presently around $76,000, it could have a hard time recovering in the near future.
What Do Other Technicals Show?
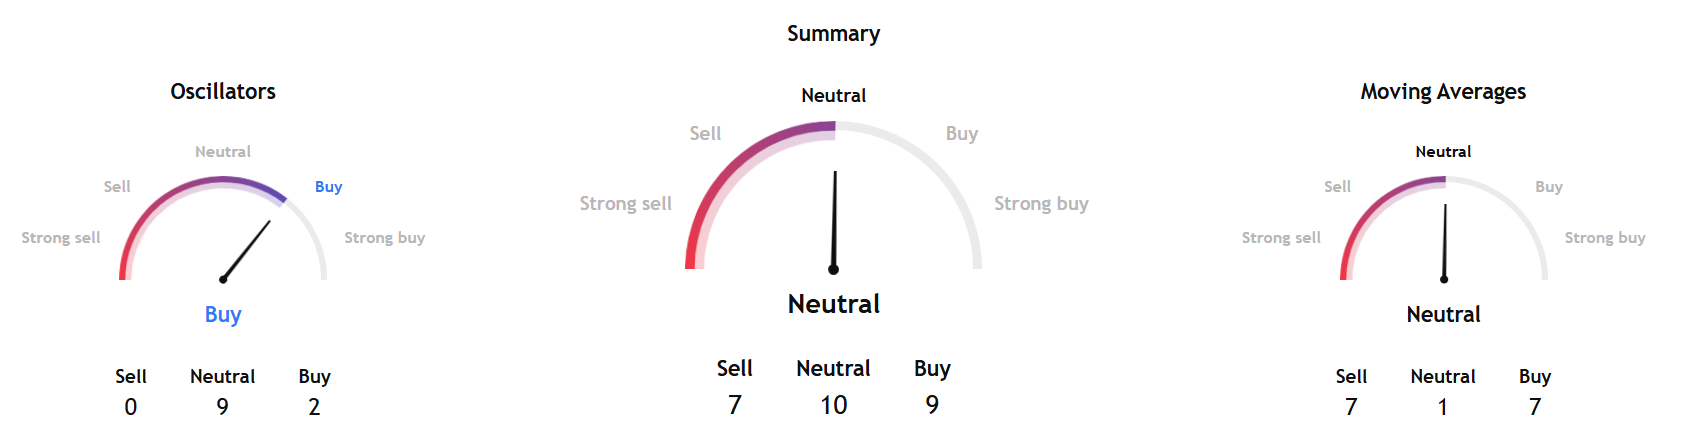
TradingView's technical analysis overview for the coming week based on key data from moving averages, oscillators, and pivots points to a neutral stance, with oscillators giving a "buy" signal.
Separately, InvestTech's Algorithmic Overall Analysis and recommendations for one to six weeks was positive score.
The research said, "Bitcoin has broken the floor of the rising trend channel in the short term, which indicates a weaker initial rising rate. There is no resistance in the price chart and further rise is indicated. In case of a negative reaction, the currency has support at approximately $74,300. RSI above 70 shows that the token has strong positive momentum in the short term."
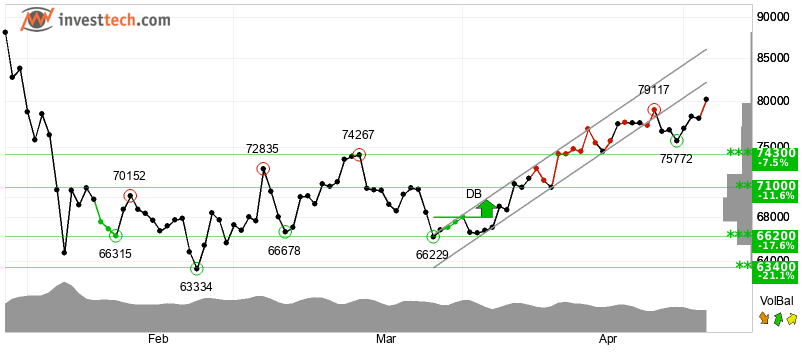
InvestTech added, "Investors have steadily paid more to buy the token, which indicates increasing optimism and that the price will continue to rise. However, particularly for big stocks, high RSI may be a sign that the stock is overbought and that there is a chance of a reaction downwards. The token is overall assessed as technically positive for the short term."


