

Table of Contents
The sharp increase in Bitcoin's price to $81,500 last week signalled a change in sentiment. A closer look at the numbers shows a market highly dependent on leverage and lacking a clear trend or conviction.
The data tells a story of development. In just seven days, the total market value of cryptocurrencies jumped from $2.21 trillion to $2.64 trillion.
The once-languid $40 billion in daily trade volume exploded to a buoyant $162 billion, according to ChainCatcher. For three straight sessions, the iShares Bitcoin Trust's call option volume surpassed 1 million contracts, reaching a record high of 1.58 million contracts. The 25-delta call skew shifted into positive territory for the first time since October 2025 as merchants increased their investments in anticipation of possible benefits.
The bulls seemed to have made a triumphant return.
Then, Larak Island was attacked. Iran fired missiles at a US station in Jordan in retaliation for American operations targeting Iranian rocket launch sites near the Strait of Hormuz on Sunday.
From its Sunday high, Bitcoin fell sharply, falling below $77,000. The market capitalization of cryptocurrencies lost billions of dollars as a consequence of the massive selloff that this collapse prompted.
Long leveraged holdings worth around $400 million have been destroyed. Concerns about geopolitical instability were the main cause. That, however, is only a preliminary reading.
The story's central premise is that the so-called "recovery" has always rested on shaky ground.
The Macro Hook
The Federal Reserve's outlook reveals the truth even before the strikes over the weekend. At Jackson Hole, Fed Chair Kevin Warsh hinted that further rate hikes could still happen if inflation did not reestablish itself at the 2% objective.
The market was quite responsive. There was a 56.9% increase in the probability of a rate hike in September. A single session saw a 12.8 basis point spike, bringing the 2-year Treasury yield to 4.36%.
Risk assets are greatly affected by such a macro challenge. An already unstable environment was the setting for the attack in Iran.
The chain reaction is obvious: concerns over the supply of oil from the Hormuz region cause prices to surge to $90 per barrel, which in turn renews expectations of inflation.
This causes market participants to become more risk-averse and the probability of rate hikes to rise, which boosts the value of the dollar.
Because of its extreme volatility, cryptocurrency took the brunt of the first blow.
Structural ivergence
The market's internal signals are indicating caution.
This represents a pivotal moment of failure. The market capitalization of stablecoins, which serves as the most accurate indicator of fresh fiat currency flowing into the cryptocurrency ecosystem, is showing minimal fluctuations.
Only USDC has demonstrated a slight uptick.
We are not observing the same level of stablecoin growth that fueled the rallies of 2024-2025, during which USDT experienced a remarkable increase from $120 billion to $196 billion, according to ChainCatcher.
The surge we just observed was not a result of fresh capital, but rather the reallocation of existing funds through leverage.
Heading into the weekend, the Crypto Fear & Greed Index hit 62, suggesting a Greedy mood. That predicts a gloomy future after a 31% recovery from the low point.
Market participants leave themselves open to potential threats when they act greedily by taking long positions at resistance levels. Large investors and regular people couldn't be more different. In under 60 days, large holders have accumulated 46,420 BTC. Important stakeholders amassed around 39,000 BTC in a mere seven days.
$3 BILLION IN BITCOIN BOUGHT BY WHALES
— Ali Charts (@alicharts) August 30, 2026
Whales accumulated more than 39,154 bitcoin:native over the past week, signaling continued interest by large investors. https://t.co/JbIrOvfw8F pic.twitter.com/vEPbSJiv73
The Accumulation Trend Score for individual investors with 0.1 to 1 BTC was -0.982, indicating a state very close to maximum distribution.
The major entities are consolidating resources while the smaller competitors are fleeing the scene.
That does not indicate robust market performance. It indicates that the recent surge was a strategic move by major players aimed at forcing out late investors and those with less conviction.
The Real Test
At the moment, 1 Bitcoin trades at $77,600.
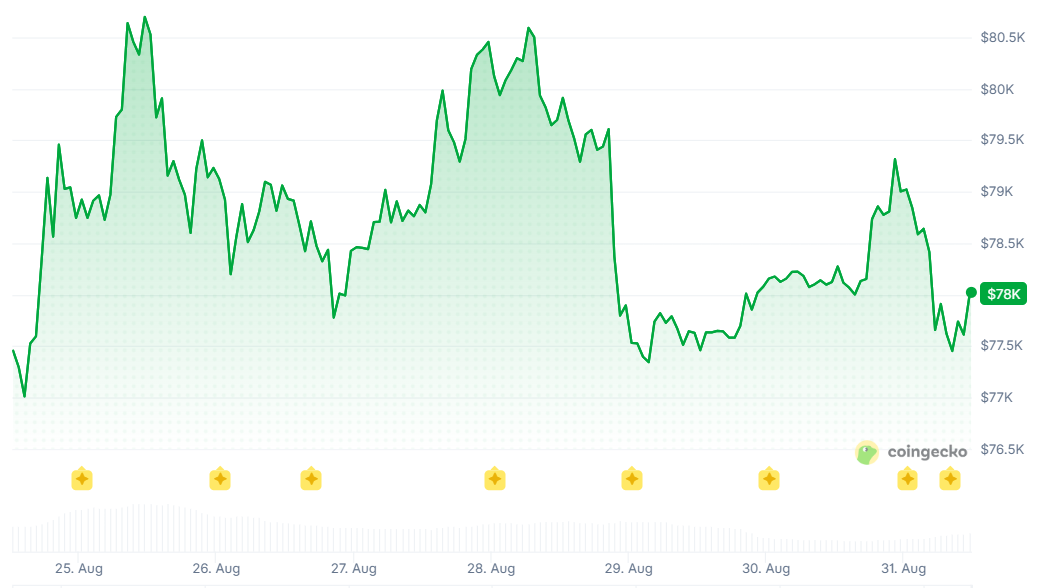
According to TradingView, it has dropped below the critical $78,000–$82,000 resistance zone, which experts had recognized as a major obstacle.
In the near term, funds between $76,000 and $77,000 are set aside. A drop to $70,000–$72,000 may be in store, though, if this level is broken.
Since there is still not a lot of interest in buying puts, the options market seems to be looking hopeful, according to SoSoValue.
On the other hand, we will be able to see whether institutional ETF inflows make a return when US markets start operations, which is when the real appraisal will happen.
After strong inflows for nine days in a row, the Bitcoin spot ETFs saw $202 million leave their holdings on Friday. The absence of genuine institutional support will become apparent if that pattern persists.
In contrast to basic demand factors, leveraged derivatives are now driving market dynamics. The $109 billion daily volume is impressive, but it means nothing if stablecoin reserves don't grow at the same rate.
It appears that this boost is just temporary, as we are not seeing the usual inflows throughout the "August 2024 to October 2025" period.
What Other Technical Readings Show
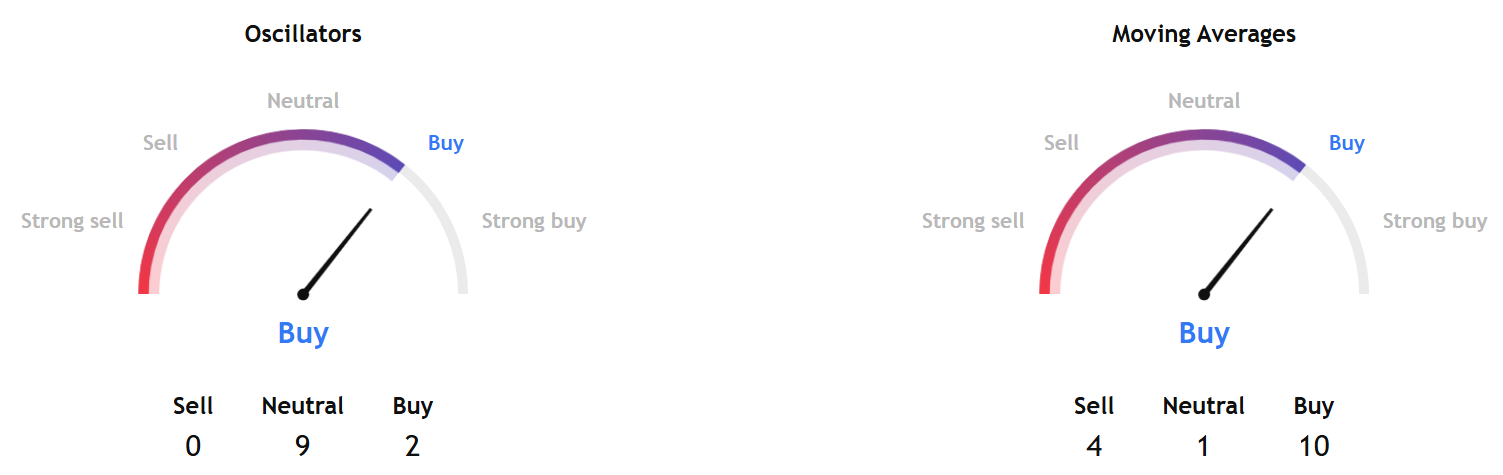
TradingView's Bitcoin technical analysis overview based on key data from moving averages, oscillators, and pivots for the coming week showed a buy signal.
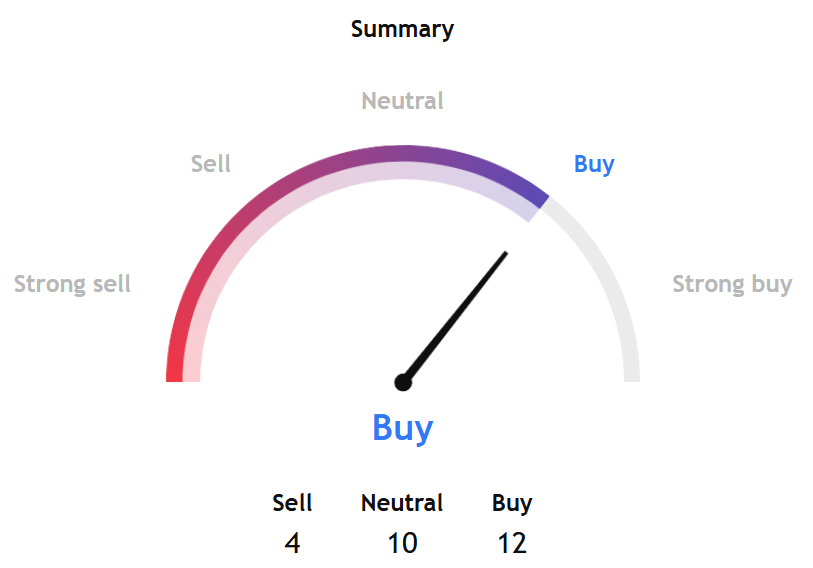
The short- and long-term gauges also pointed to a buy stance.
Separately, InvestTech's Algorithmic Overall Analysis showed a "positive" score, while the recommendation for one-to-six weeks pointed to a "Weak Positive" note.
The research noted, "Bitcoin is within an approximate horizontal trend channel in the short term, which indicates further development in the same direction. The currency has support at $63,000 and resistance at $80,400. Positive volume balance indicates that volume is high on days with rising prices and low on days with falling prices, which strengthens the currency. RSI is above 70 after a good price increase in the past weeks."
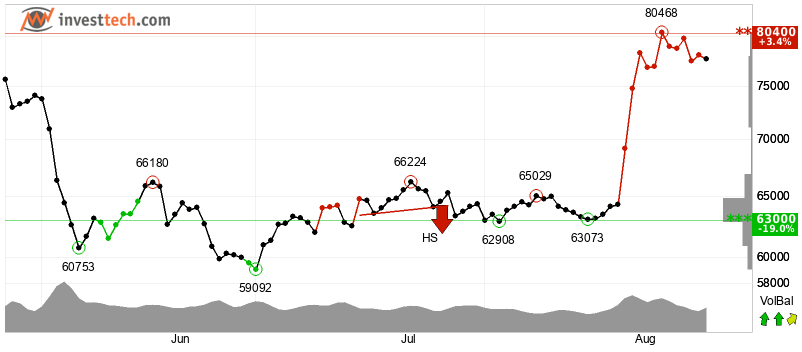
InvestTech added, "The currency has strong positive momentum, and further increase is indicated. However, particularly for big stocks, high RSI may be a sign that the stock is overbought and that there is a chance of a reaction downwards. The currency is overall assessed as technically slightly positive for the short term."
 Blockhead