
Table of Contents
Despite the best efforts of buyers, the selling pressure on Bitcoin (BTC) has stalled a sustained bullish rally. The dip in trading volume hasn’t been beneficial to buyers with BTC lacking its usual volatility.
The selling pressure was evidenced over the past 24 hours as BTC broke past the $61.7k resistance but quickly dipped to touch the price zone with successive bearish candles on the four-hour timeframe.
With two key resistance levels still present at $64.7k and $68.3k, the odds of BTC reaching $70k in the short term appear slim.
Are Runes Having a Negative Impact on BTC?
The Runes protocol launched with a lot of buzz on April 19, coinciding with the Bitcoin Halving Event. In the first week, it raised over $135 million in Bitcoin transaction fees due to massive interest from collectors and steep competition for block space.
This was advantageous for Bitcoin miners, as they enjoyed record-breaking fees for supplying computing power for these transactions. After enjoying a remarkable opening week, Runes activity on the Bitcoin blockchain has considerably slowed down.
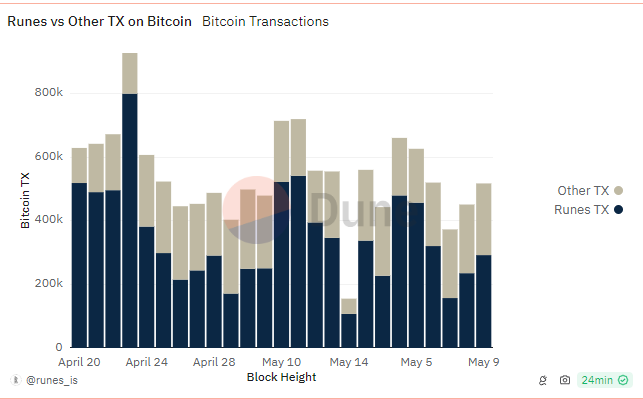
This chart by Runes Is showed that Runes were significantly contributing to Bitcoin transactions. Therefore a decline in Runes interest was bound to impact the entire Bitcoin ecosystem, especially in relation to transaction fees and benefit to BTC miners.
 Blockhead
What Next for BTC?
Analyzing BTC’s price action on the four-hour timeframe showed that there was still decent capital inflows, as the Chaikin Money Flow (CMF) registered a reading of +0.09.
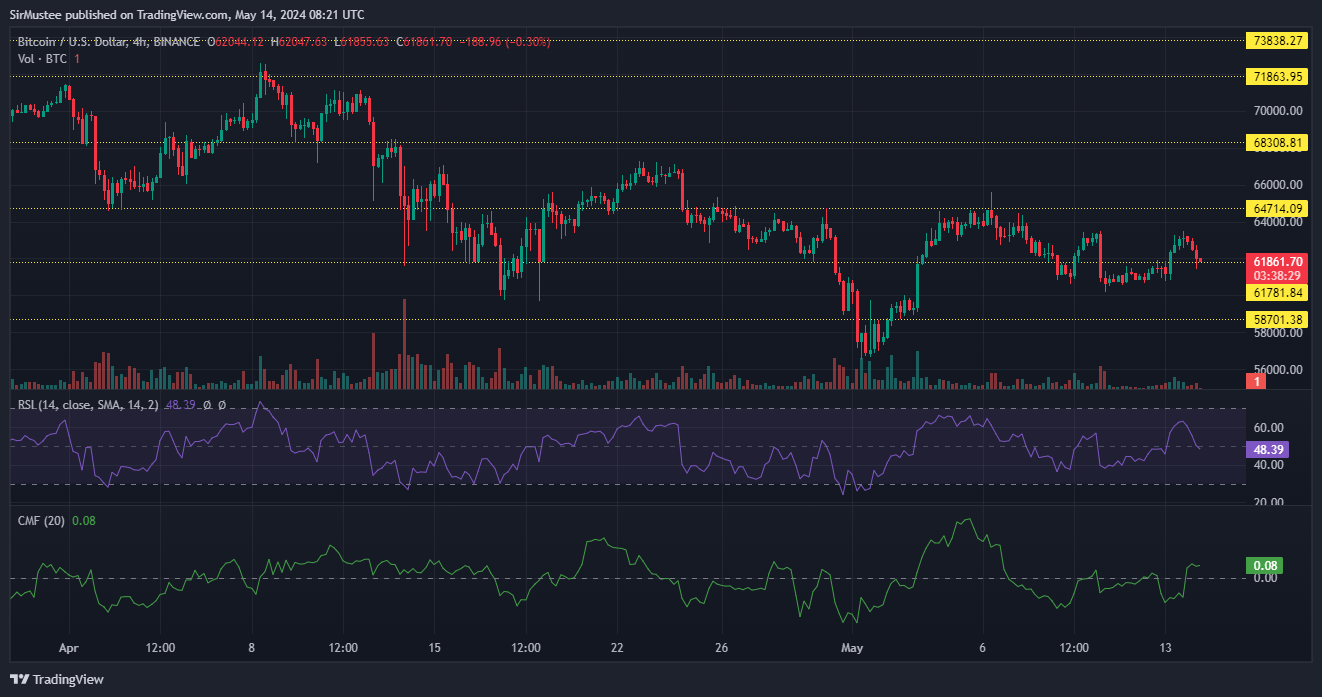
However, the Relative Strength Index (RSI) leaned bearish, as it dipped below the neutral 50.
This combination of mixed signals from the on-chart indicators hinted at indecision by market participants. As such, BTC trades should be approached with caution, due to potential for spikes in either direction.
A good strategy would be to observe the price action around the support/resistance areas and open small positions on spot/futures markets, dependent on strong bullish or bearish candles at the levels.
Disclaimer: This article does not constitute trading, investment, financial, or other types of advice. It is solely the writer’s opinion. Please conduct your due diligence before making any trading or investment decisions.


