
Table of Contents
AI (Artifical Intelligence) tokens have captivated the crypto market with the combination of AI and blockchain technology too good to resist. One of the leading AI tokens is Fetch.ai (FET).
Sitting at #71 in the top 100 cryptocurrencies, FET currently has a marketcap of $1.455 billion, making it one of the top AI tokens around.
Recently, Fetch.ai announced a major collaboration with Deutsche Telekom, Europe’s largest telecommunications provider, and Bosch, a global leader in technology and services. This partnership aims to integrate AI and blockchain, enhancing industry innovation across various sectors.
This announcement had a big impact on FET’s price, with the token jumping by 41% over the past three days.
What is Fetch.ai?
Fetch.ai is a decentralized AI platform built on blockchain technology. It aims to enable an ecosystem where autonomous agents, powered by AI, can perform tasks, interact, and transact with one another in a decentralized manner. The platform facilitates the development of AI-powered applications across various industries such as finance, supply chain, healthcare, and transportation.
Fetch.ai provides an open economic framework that allows agents to transact with each other using Fetch.ai's native cryptocurrency, FET. This facilitates the exchange of value and incentivizes participation in the network.
Is the Bullish Rally Over for FET?
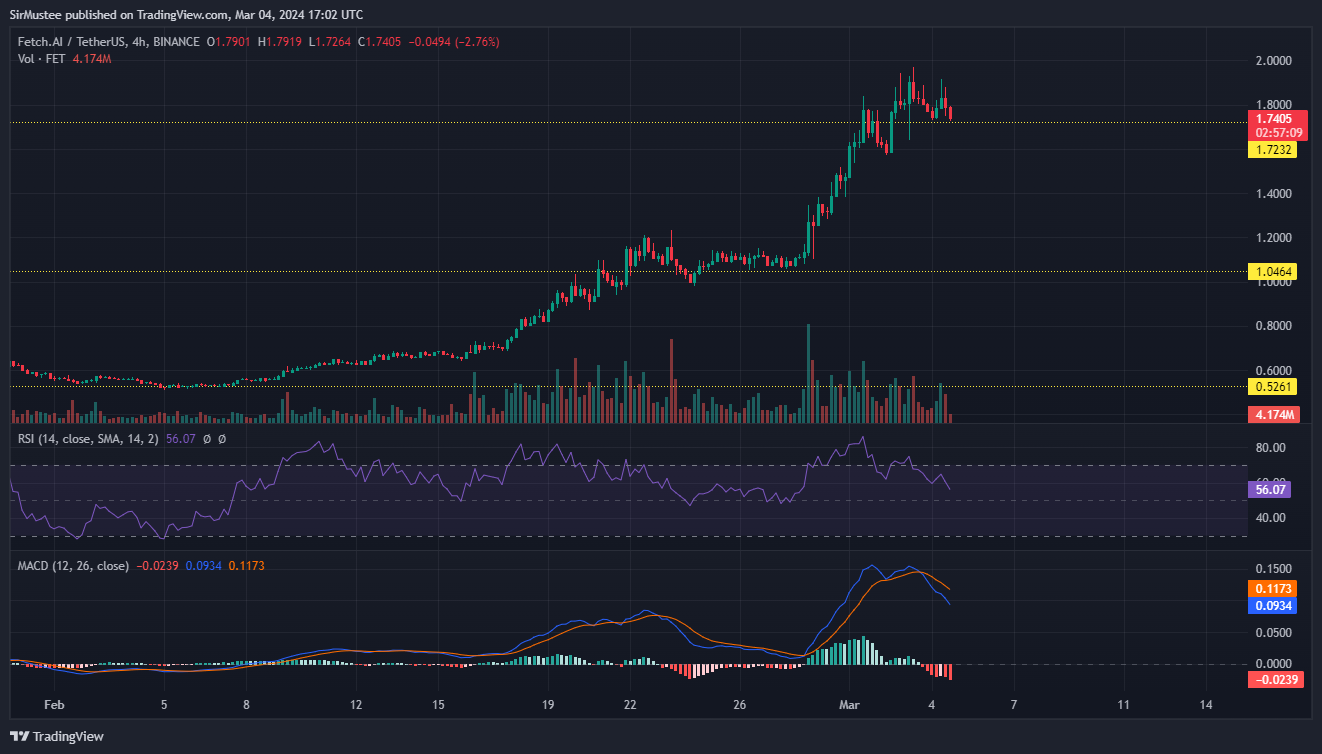
The 41% jump for FET over the past three days saw it jump from $1.25 to a high of $1.97 before retracing to trade at $1.74, as of the time of writing.
While FET maintained its uptrend, the chart indicators suggested further dips could occur in the short term. The Relative Strength Index (RSI) stayed above the neutral 50 but it dipped massively from the overbought zone, signaling waning buying pressure.
This resulted in the Moving Average Divergence Convergence (MACD) indicator posting a bearish crossover with red histogram bars under the zero level on the four-hour timeframe.
Despite these bearish indicators, price stayed above the support level of $1.72, suggesting two price outcomes in the short term.
A strong bullish candle close at the support level could lead to a rebound with FET poised to reach $2 for 18% gains from its current price level. Alternatively, a break of the support level with a bearish candle below $1.72 could see FET dip to $1.3 - $1.4, resulting in a 21% profit for sellers.
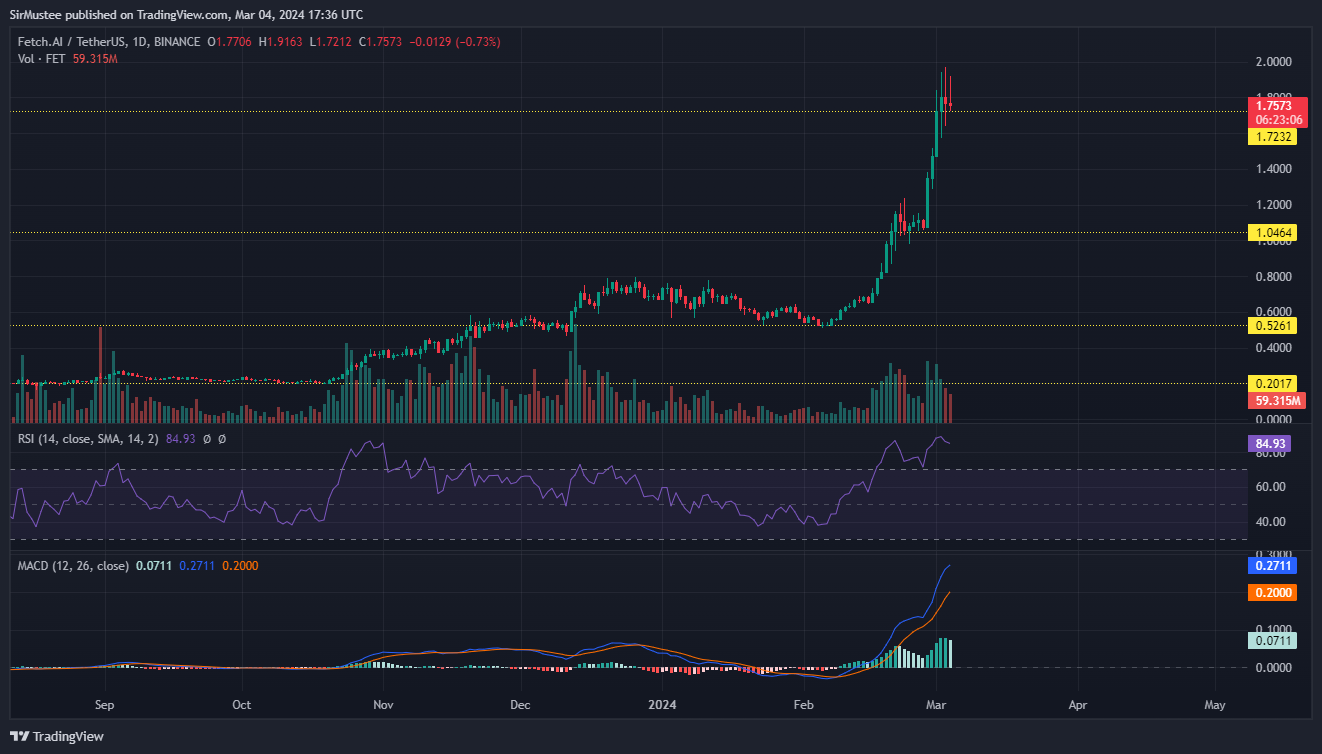
While the four-hour timeframe highlights the possibility of FET moving either bullish or bearish in the short term, the daily timeframe showed the long term direction remained bullish.
As such, traders looking to take a short position should approach the trade with caution, due to the long term outlook remaining bullish.
Disclaimer: This article does not constitute trading, investment, financial, or other types of advice. It is solely the writer’s opinion. Please conduct your due diligence before making any trading or investment decisions.


