
Table of Contents
After hitting an all-time high of $2.4, Arbitrum (ARB) has experienced a steep price retracement that has seen the altcoin sink under the $2 price level. This erased over 50% of the gains made in early January.
While buyers remain present as occasioned by a few price reversals, the overall trend has been bearish with ARB approaching a critical support level. Can buyers mount a sustained reversal from this support zone?
Bearish trendline highlights intense selling pressure
ARB’s price action on the four-hour timeframe revealed the bearish dominance with price forming a series of lower highs. This series of lower highs has led to a bearish trendline which acted as a barrier to the recent bullish attempt to rally from the $1.743 support level.
With price headed to the support level again and the bearish sentiment in the market, bears could be looking to extend the selling pressure by breaking the bullish defense at the level.
However, historic price action showed bullish strength at the $1.6 to $1.7 price zone. Therefore, traders can wait for either of these confirmation signals before entering a buy/sell position.
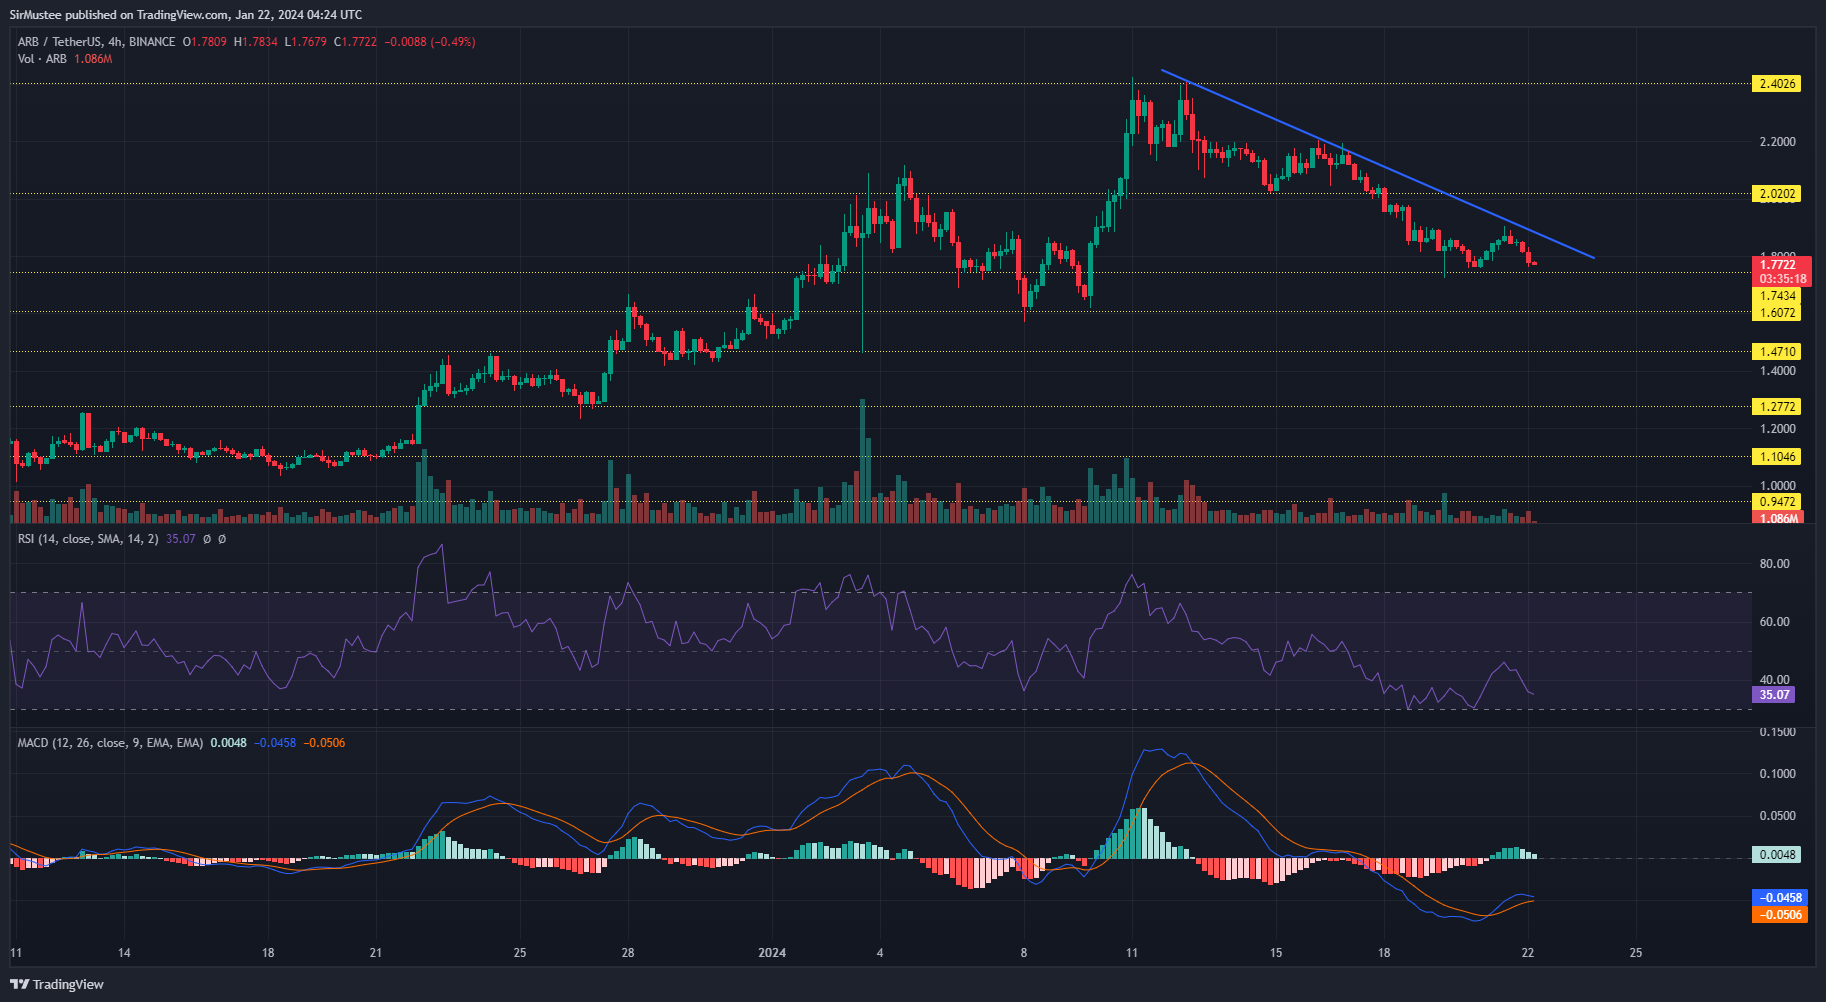
A strong bounce from the $1.743 support level in the form of a significant bullish candle would signal buyers to enter new positions with a 12% profit target.
On the other hand, a bearish break below the support level could hint at sellers extending the selling momentum with a 13% drop to $1.5 a possibility.
 Emmanuel Musa
The chart indicators currently favor a bearish extension with the Relative Strength Index (RSI) approaching the oversold zone and the Moving Average Convergence Divergence (MACD) poised to register a bearish crossover.
Short-Term Price Levels to Consider
Potential Buy Entry - $1.8
Potential Buy Exit - $2
Potential Sell Entry - $1.7
Potential Sell Exit - $1.5
Disclaimer: This article does not constitute trading, investment, financial, or other types of advice. It is solely the writer’s opinion. Please conduct your due diligence before making any trading or investment decisions.


