Table of Contents
Hurst cycles analysis underpins all technical analysis and lets you draw the see what is really driving the market, revealing when and where peaks and troughs will form and more importantly whether these turns are major or minor. https://notes.hurstcycles.com/
The macro landscape is still driven by inflation expectations and what the US Federal Reserve's rate stance is. The US dollar is in a big cycle bottom zone and conversely commodities and blue chip crypto are largely in a peak zone. In other words, we are still looking for a meaningful macro rotation and soon.
Bitcoin
the recent parabolic run is in the 80 day cycle peak zone with the next trough due early February - waiting for a modest reset down, but will be guided by price action in real time as this unfolds.
The chart highlights what we believe is the current 40 day cycle and the last 20 day cycle in the 80 day cycle that started up at the end of November. Our analysis still suggests that price is in an 80 day cycle peak zone here (albeit within a longer term uptrend) and that a reset is due imminently. With that said however, for now we are not expecting a dramatic downside resolution. The next 80 day trough is due in the first week of February.
Dollar Index
If the 20 week cycle has troughed already it lasted only 4 days (super bearish and improbable). Otherwise its still due. However, the cycle is starting to stretch too far: still improbable, but less so...
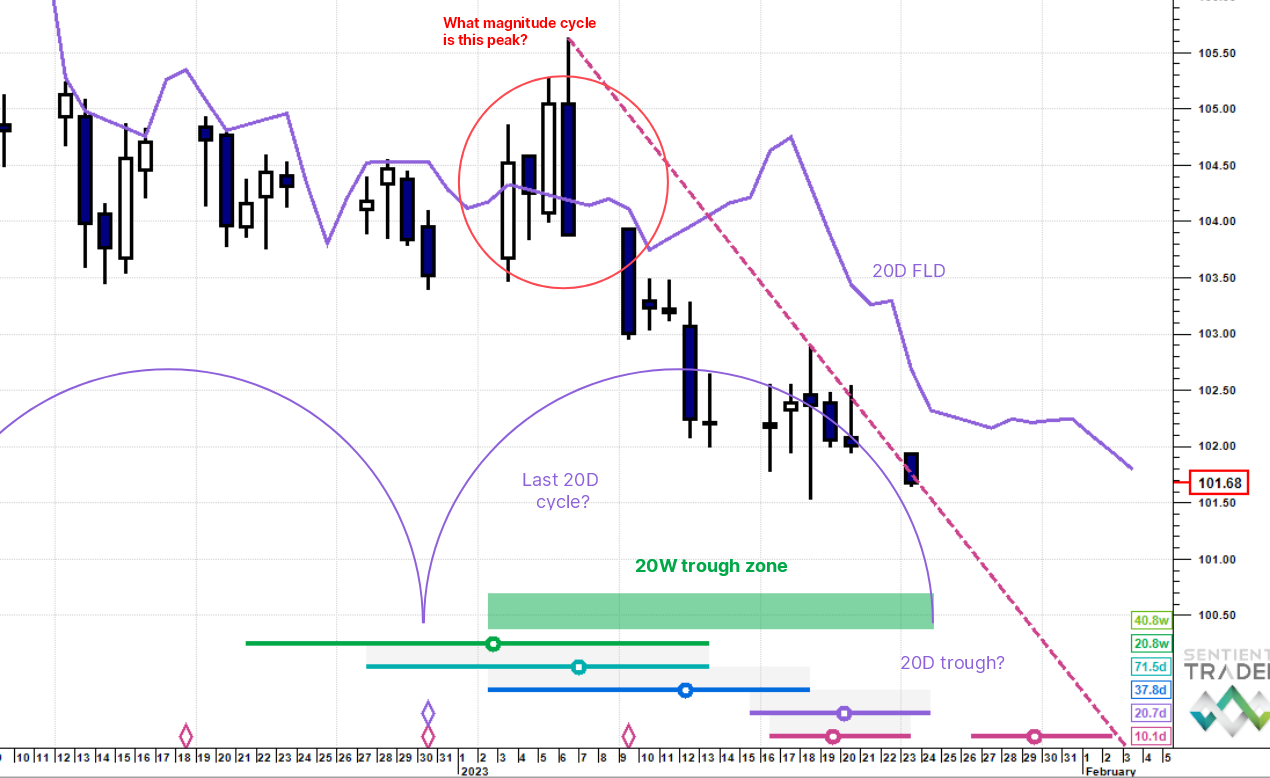
In last week's note (16 January), the view was that the 20 week cycle trough was still due, but would likely come in a bit later and lower. Since we have been tracking the elusive 20 week trough for some time now, let's see if the case for doing so still holds up.
The recent average wavelength of the 20 week cycle is 20.8 weeks (bottom right of the chart). However, it is now 23.6 weeks since the last 20 week trough in August 2022 and now a month overdue. If the trough still lies ahead it implies that we are in the last 20 day cycle. But the outer edge of the trough for this cycle is tomorrow (24 January). To confirm the 20 day trough (and therefore also the 20 week trough, because they will occur at the same time) price needs to jump through 102.7 where the 20 day FLD is. So at the moment we still lack firm evidence.
If the 20 week cycle has already occurred, then we will not know for sure unless price breaks down through 100 when the analysis would update. The only recent candidate for a 20 week trough is the local low at the end of December. But this would mean that an entire 20 week cycle gained just 2% and lasted 4 days! (red circle on chart). This is highly improbable and would be bearish in the extreme, which does not fit with our view on Gold and Copper in peak zones.
We are choosing the less improbable argument that the 20 week cycle wavelength is extending and will simply watch price grind lower potentially into the 100/101 handle or until some technical clues start presenting themselves.
It's not ideal, we would prefer to make a clearer call, but the market will not let us do so here. We wait.