
Table of Contents
Dollar index
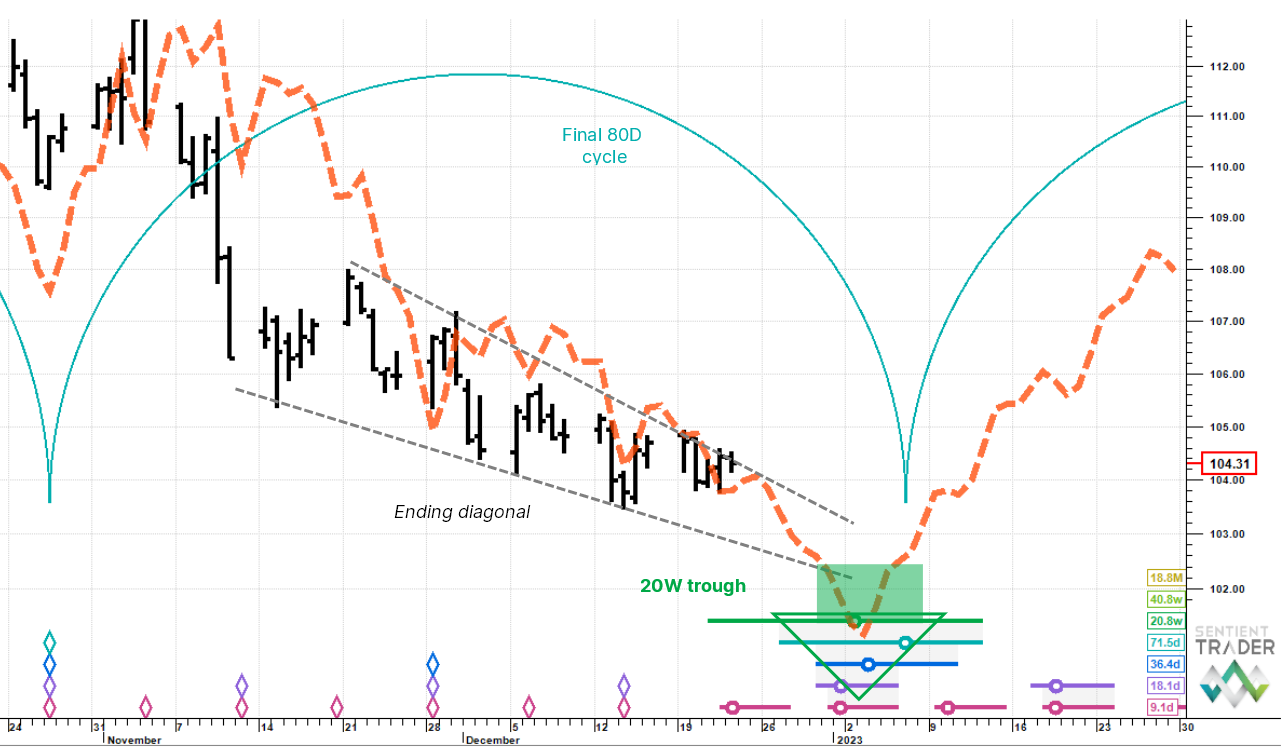
The 20 week cycle that started up on 10 August has an average wavelength here of 20.8 weeks (going back six cycles). Price is now 19.3 weeks along its trajectory and the cycle is mature with the next trough due around 5 January. The status of this underlying cycle is theoretically therefore hard down.
Price action since mid-November has been zigzagging down at a shallowish angle within converging trendlines. In certain circles this is called an “ending diagonal” and typically these structures mark the end of a longer downtrend – in this case the 20 week cycle. We therefore anticipate a meaningful trough and potential upside reversal soon.
The 80 day cycle has been drawn in and in Hurst cycle analysis if the 20 week cycle bottoms, then so too does the 80 day cycle and at the same time. This is called the principle of synchronicity.
The orange dashed line represents the composite cycle and is the theoretical sum of all cycles in the nominal model, from very long to very short, currently at play in the chart. As you can see, this composite line turns sharply up in early January.
Gold
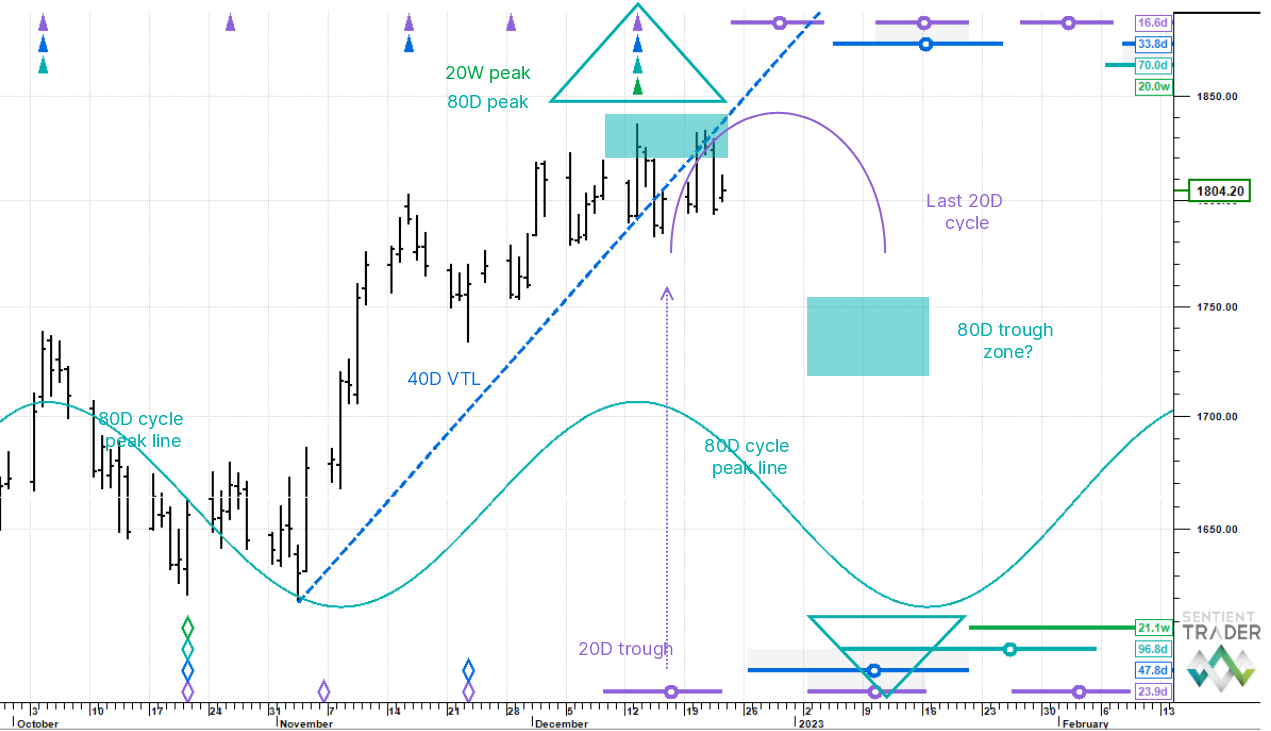
This week’s outlook is more or less the same as last week’s. On 15 December, price cut down through the 40 day cycle valid trendline, which confirms that the 80 day cycle peak is in place (and likely also that of the longer 20 week cycle).
This skews risk to the downside and price looks to be rotating through the last 20 day cycle (of four) in the 80 day set. The 80 day cycle trough zone is still quite wide, but the expectation is a decline into the target box by the second week of January. This is consistent with an advance in the US dollar.
Euro Dollar
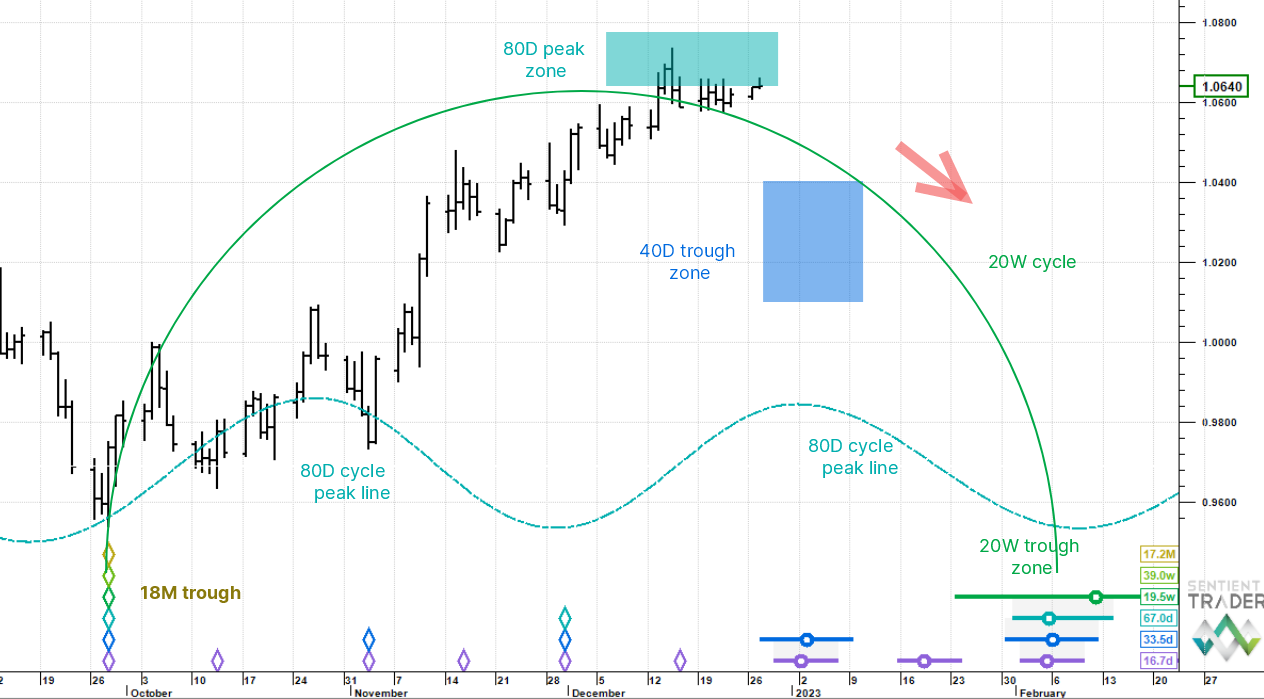
The Euro is in an 80 day cycle peak zone, which starts skewing risk down. The next downside aiming point is the 40 day cycle trough, which is due around the first week of January. The 80 day cycle peak line clearly describes the fluctuation of this cycle and where the 80 day peak is placed we would naturally expect to see the 40 day trough occur.
One thing to note about the overall shape of the chart is that the cycle peaks are being pushed forward in time. This peak right translation is longer term bullish and is being caused by the rising 18 month cycle which bottomed at the end of September.
S&P 500 E-minis
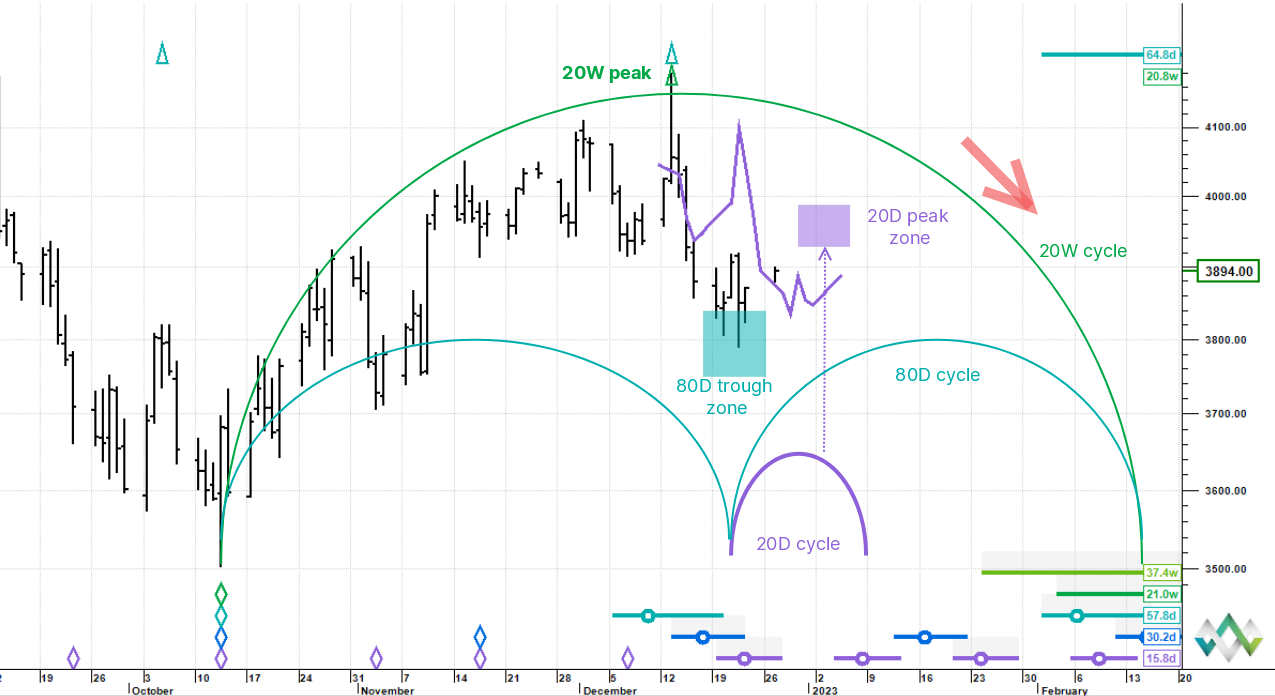
The anticipated 80 day cycle trough looks to have come in on time and price has started to rotate higher in the first 20 day cycle out of it. The 20 day FLD has been crossed to the upside and projects to the 20 day cycle peak target box expected in early January.
At this stage we are not expecting very much upside carry through because the longer underlying cycle (the 20 week cycle) is still pushing down and acting as a headwind. We can review this once the current 20 day cycle tops out when we will have more cycles data.


