Table of Contents
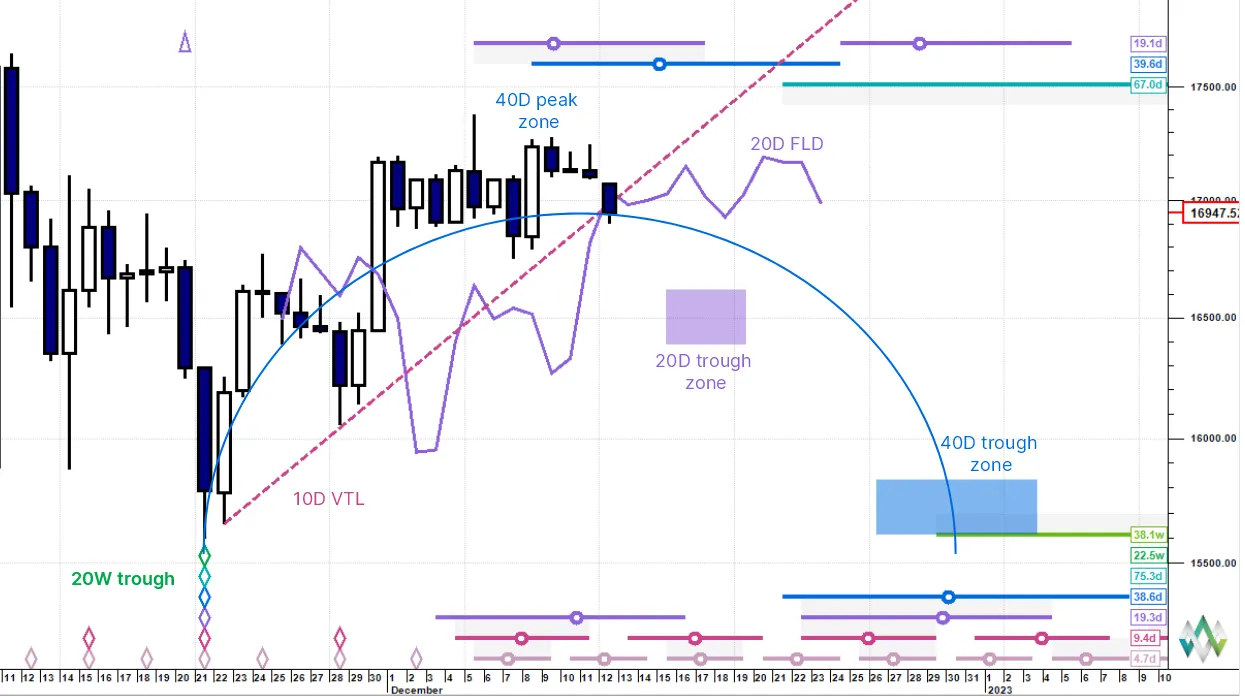
The overall broad trend remains down and the anticipated 40-day cycle looks to have just peaked. This is confirmed by the downside break of the red up trending line associated with the 10-day cycle (the 10 day VTL). The breakdown here has not quite occurred yet but it will confirm the 20-day cycle peak which in this case also confirms the 40 day cycle peak shifting risk to the downside.
If price crosses cleanly down through the 20-day FLD (the purple offset 20 day cycle) then price then projects down to the 20-day cycle trough circa 17 to 20 December around 16,500. This in turn projects down to the 40-day cycle trough due at the end of the month around 15,700. One of the factors affecting Bitcoin’s bearishness now is the potential bottoming of the US Dollar, which looks to be passing through a 40-day cycle trough.
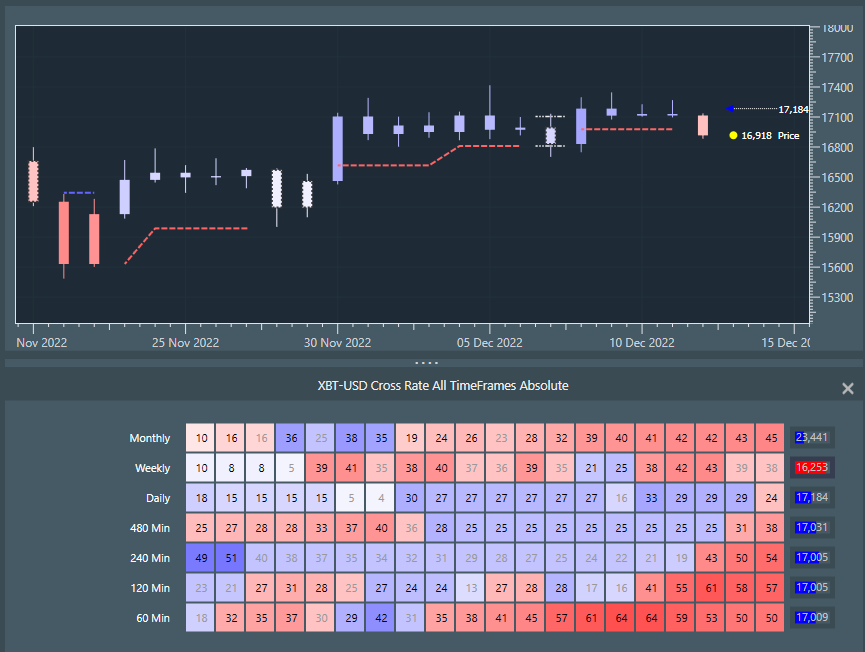
I am deploying another tool today a dynamic heat map showing multiple timeframes at the same time. Basically blue is up trending and red is downtrending. Stronger reds and higher numbers mean more downside power. The chart is daily data and has just broken down to red. The monthly and weekly rows in the multi timeframe sub window are red, which means that the underlying trend is down. Daily has just broken to red, as seen in the chart and all intradays are red meaning price is collapsing below the daily level. This is consistent with the downside cycles view.


