Table of Contents
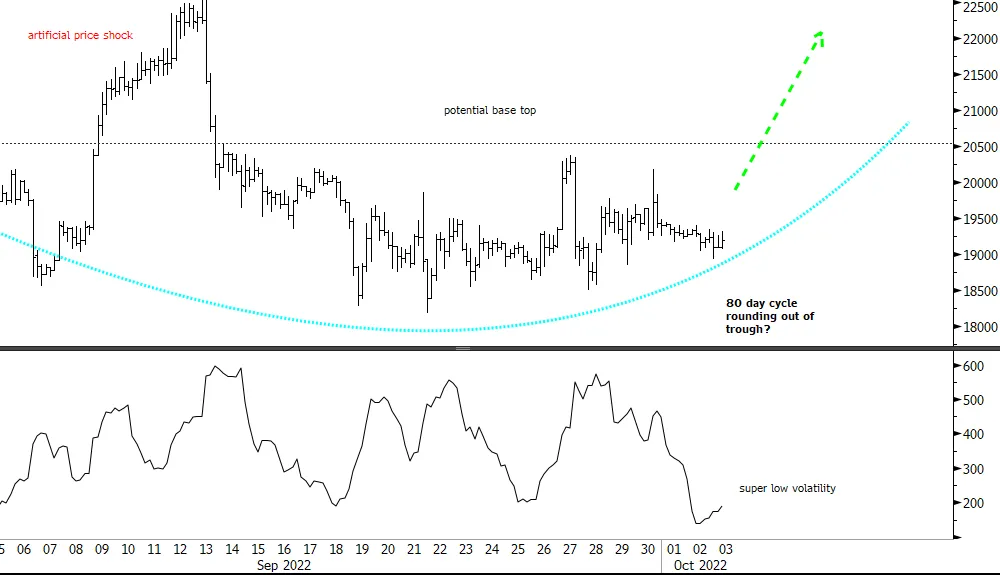
The analysis of the 240-minute Bitcoin chart here is still running with the theme that the 21 September price low (mid chart) was that of the 80-day cycle. This tilts the projected price trajectory higher intermediate term and what is more a few degrees of magnitude behind this cycle is the key 18-month cycle, which I am certain bottomed on 18 June. Which means it is still very young and rising.
That there would be a robust longer term tailwind makes sense fundamentally. On the one hand Bitcoin as a concept itself is starting to make more and more sense. Especially when we look at the chaos and insecurity of fiat money and the current inept shenanigans of central banks and governments. Here in the UK, we were just treated to a spectacular display of buffoonery by our new chancellor of exchequer, which very nearly blew up everyone’s pensions and the bond market in one magisterial stroke.
Then we learn that the Bank of England has a nice 45-page document on how to conduct bail-ins (that’s where the banks step in and steal your savings a-la Cyprus a few years ago). So normies (i.e. non-traders and speculators in crypto) are starting to think of safety.
Anyway I digress and so back to the chart here. This whole structure looks like a U-shaped base that was temporarily blown up in the second week of September in what looks like an exogenous price shock, after which price recovered its base building trajectory. The top of this base is circa US$20,500 and I believe that this is the near term liquidity magnet.
Volatility as expressed by Average True Range in the sub-window is extremely low and typically low vol leads to high vol. And since the view is for more upside this should feed into a price expansion higher. The preferred view is that the base forms (i.e. we break the top) and acts as a foundation for a meaningful advance beyond.


