Table of Contents
For me, the most important chart currently is the US Dollar index (DXY). On the one hand, it is a good proxy for inflation and therefore recession, and therefore Fed action (currently destructive to the market and probably by design).
As the dollar rallies, it speaks to more economic stress and as a corollary the continued dumping of risk assets. More prosaically, it is also the denominator to the main crypto pairs and thus as DXY rises, the denominator rises and the fraction (e.g. Bitcoin | USD) grows smaller and the chart declines.
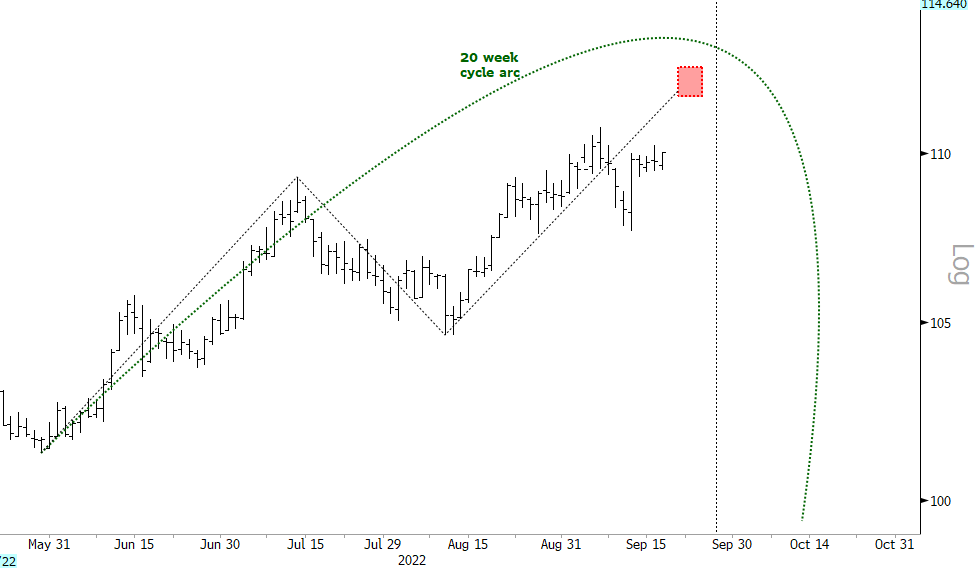
In cycles’ work, it’s typically the troughs that are most important, but in DXY for reasons too involved to go into in this note, it’s the peaks that have most impact. The daily chart highlights the 20-week cycle that has been running since the end of May. Price is currently powering up towards the 20-week cycle peak which is due at the end of this month and likely just sub-112. The price path is up and the next trough is due around mid-October.
Once the 20-week cycle tops, the sell off should be fast and violent, risk will rally, and crypto will rally. However, the dollar will very likely regroup lower and then start pushing higher again – thereby adversely affecting risk assets. Notice how the arc of the 20-week cycle is skewed heavily to the right – this is called time translation and speaks to a higher cycle pushing up beneath the surface.