Table of Contents
Yesterday we looked at Ethereum and the Flag pattern emerging – basically for a downside case that looks like this: a hard runaway move down followed by a straggly overlapping correction which slopes up, then the pattern ends and its back down again. We looked at a potential downside pattern breakdown already emerging in yesterday’s note, but it reversed back on itself.
The formation is more or less the same in Bitcoin, so I am switching over to this today and dropping down to the 240 minute chart level. When you need to do a closer analysis ahead of a specific call to action on your base timeframe, this is what to do: jump lower.
Generally speaking it’s best to perform your analysis where you are most comfortable owning risk, typically daily data and use this as the handrail. Lower timeframe charts seem to be busier and if you follow them too closely you can end up getting spun around, so deploy them closer to when you want to execute your view.
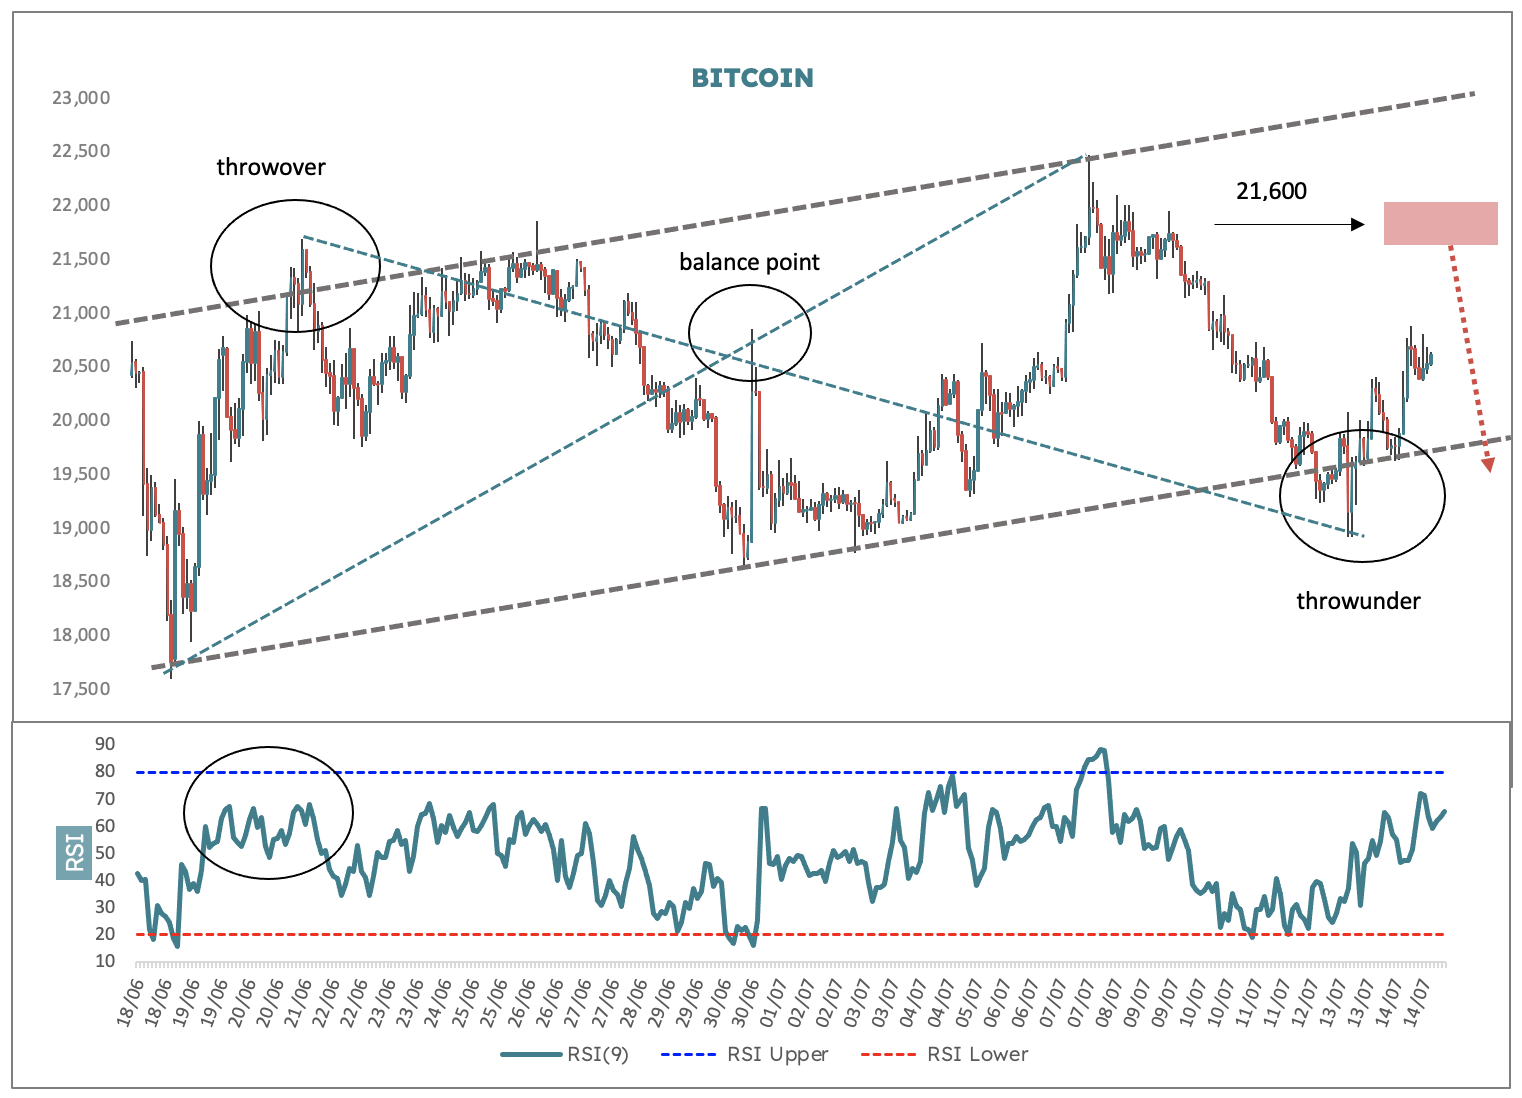
The basic idea in this chart is as follows: price is climbing in a countertrend move back into the flag with a clear resistance layer around US$21,600, marking the consolidation phase in the previous sharp leg down. The preferred view for now is that there is a failure here and it’s back down.
A couple of technical pointers on price action around the top and bottom of the channel. On 21 June price exuberantly spiked higher then collapsed in on itself in a mad dash to extend the advance. Notice RSI failing into this and the little bearish M top.. This is called a throwover (price is thrown over the line and returns sharply – it’s a market failure more or less).
Now look at the spike lower and rebound on 13 July, this is the same concept but in reverse and is called a throwunder. Because the market is always looking to balance itself, we often see this sequence – failed break up and then failed break down to balance it out across a pattern. Note also the intersection of lines mid chart where price failed again mid chart, this is also often seen in a balancing move.