Table of Contents
Since the big low in Nasdaq in March 2020, there has been an 80% correlation in Bitcoin. This tightened up to 92% from the big top in late November 2021.
So as we have discussed in previous notes, Bitcoin and the Nasdaq are tightly coupled and since Nasdaq trades more and has more institutional support than Bitcoin, it’s not unreasonable to assume that Nasdaq leads. It doesn’t hurt therefore to occasionally do a read across and see where the analysis leads us.
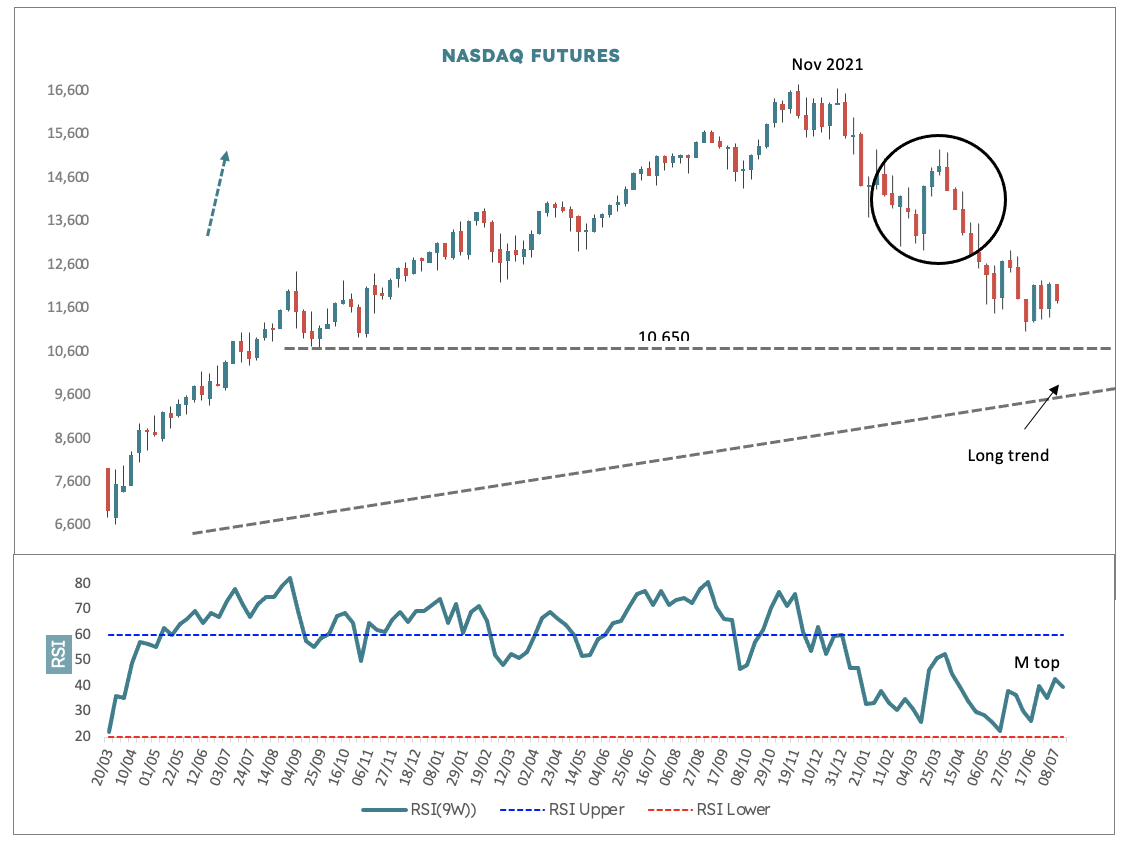
As seen in the weekly data chart above, the drop from the November 2021 high looks like a correction down. You will remember perhaps from the recent Elliott Wave study notes that when a move has a big “divided in the middle” look to it (circled), then it is usually a correction, which means that the longer trend in this case must still be up. Additionally, and not shown here, there is a big 80-week cycle trough due late August, early September this year. This will almost certainly mean a significant advance at that time and further enhances the current corrective structure thesis.
The price path in NQ1 remains down and the recent sideways shuffle in price action looks like a normal downtrend continuation pattern. There is an obvious layer of potential support just below US$10,700 (nearly 10% lower) but a more intimidating level around US$9,910 which corresponds to the February 2020 top and a trend line that can pretty much be traced back to the 2009 recovery base.
Nine-week RSI in the sub-window is bearish here. That little M top (and recall the RSI study notes sent a few months back) implies more downside. So all told for now, NQ1 and therefore crypto remain heavy.