
Table of Contents
A tidal wave of recovery started after Bitcoin's price went over $62,000. The price of the top tokan is showing signs of stabilization, and it may attempt to break over the $64,500 resistance level in the near future.
The price of Bitcoin has been stable over $60,000 for an extended period of time.
After laying the groundwork and positioning itself over $61,200, BTC began a trend of recovery.
There was a rise that went beyond the $62,000 and $62,200 marks.
According to TradingView, on the hourly chart of the BTC/USD pair, there was a breakout above a descending trend line, and the price encountered resistance at $61,500.
With their buying pressure, sellers were unable to prevent the price from falling below the $59,107 low and the 23.6% Fibonacci retracement level of the collapse from $74,100 high. Near $64,000, though, sellers are aggressive. Currently, Bitcoin's price is above $63,000, which means it has broken through the 100-hour simple moving average.
Maintaining a price over $62,000 might signal the beginning of a fresh uptrend. Near the $64,500 level, there is immediate resistance. Around the $65,000 mark is where the initial substantial obstacle is. If the price can break over the $65,000 level of resistance, it might continue to rise.
Under these conditions, the price might rise to test the $66,500 level of resistance, which is also the 50% Fibonacci retracement level of the last slide from the $74,100 high to the $59,107 low.
The price might reach $68,500 if there are more rises. The $70,000 mark may be the next bullish trend level. Bitcoin may start a new decline if it can't break through the $64,500 level of resistance.
Near the $62,800 level, you can find immediate support. Around the $62,500 mark is where you'll initially see considerable support. At roughly the $62,000 level, you may find the next support level. The $61,500 support level may be reached in the near future if the price continues to fall.
At the moment, $61,200 is the main level of support. Bitcoin could have trouble recovering in the near future if it drops below this level.
Bottom Done?
The value of Bitcoin appears to have found a more steady position at the $60,000 level after many days of considerable decrease.
But onchain data suggests the top cryptocurrency could not stay down for much longer, and a positive turnaround might be around the corner. Bitcoin's price may have already reached a major low in this cycle.
The Bitcoin Supply In Loss statistic, which measures the amount of Bitcoins in circulation that were last sold for more than their market value, is the primary focus of this analysis.
This onchain metric offers a glimpse into the level of stress that holders are experiencing, reflecting the extent to which they are facing unrealized losses on their Bitcoin investments.
Therefore, the Supply In Loss indicator, at nearly unparalleled levels, serves as a signal of widespread apprehension and a forthcoming change in Bitcoin market dynamics.
Crypto analyst Ali Martinez said on X that the leading cryptocurrency has historically established significant cycle bottoms when over 10 million BTC were retained at a loss.
Historically, Bitcoin has tended to form major bottoms when more than 10 million coins are held at a loss.
— Ali Charts (@alicharts) June 7, 2026
That threshold has now been reached, with 10.46 million $BTC currently underwater.
I believe this is an important signal because selling pressure often begins to fade as… https://t.co/DrCgCzTDqF pic.twitter.com/x4VDZx2DFd
As indicated by the data from Glassnode, the analyst points out that Bitcoin has surpassed this threshold, with 10.46 million coins (over half of the circulating supply) currently in a loss position.
At its current price level, Bitcoin appears to be establishing a low point when considering historical patterns and trends.
It's important to remember that the circulating supply of Bitcoin was considerably lower during both periods. In 2018, the figure stood at approximately 17.4 million, while in 2022, it increased to around 19.2 million.
This time, a slightly larger Supply In Loss could suggest that the circulating supply of Bitcoin is diminishing, potentially resulting in further price declines.
When the Supply In Loss did not reach the 10 million threshold before the bullish turnaround in 2015 (a year with a significantly lower circulating supply), it was evident that this was the situation.
Nasdaq vs. Crypto
Traders stressed the importance of Bitcoin's price above the $60,000 psychological support level over the weekend. On Sunday, the cryptocurrency climbed 6.5% from a low of around $59,100 to an intraday high of about $62,950.
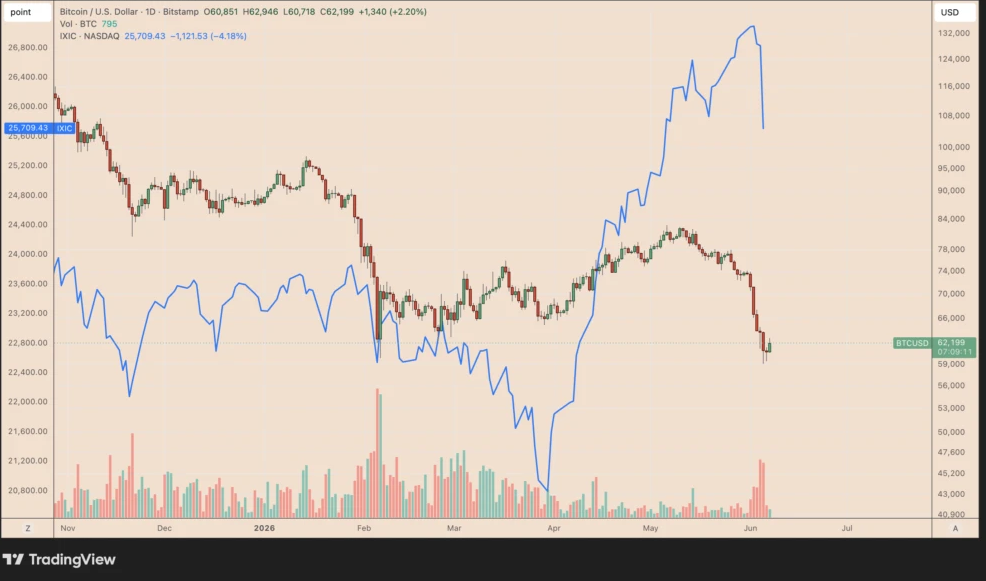
The tech-focused Nasdaq Composite saw its worst single-day drop since April 2025, falling more than 4% on Friday; Bitcoin's rebound stood out in this context. Because of this, some are hoping that risk capital will return to the Bitcoin market.
Supporters of Bitcoin were given reason to be hopeful by the insights offered by seasoned analyst Filbfilb.
The analyst said in Sunday's post that Bitcoin is still holding strong above its 200-week simple moving average (200-week SMA, blue line) at around $61,880. When determining the base for 2020, 2018, and 2015, this level was essential.
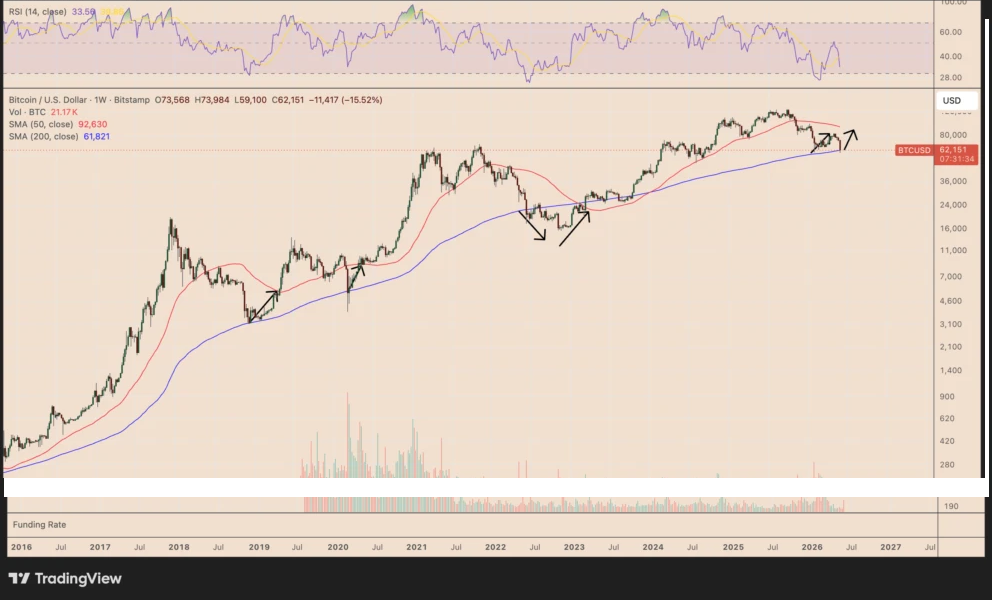
In essence, market participants might interpret the decline below $60,000 as a temporary setback if BTC maintains its position above the 200-week SMA, with the 50-week SMA (red) around $92,630 emerging as the next significant target for upward movement.
Currently, the Nasdaq seems to be adjusting towards its 20-week simple moving average, indicated by the green line around 22,905 points, following a decline in its weekly relative strength index from approximately 74.75 to 62.46.
Since 2021, each significant decline in the weekly RSI of the Nasdaq from above 70, indicating overbought conditions, has resulted in the index moving back toward its 20-week moving average.
If this trend continues, the Nasdaq would fall to roughly 22,905 by June or July, representing a possible loss of almost 10.75% from present levels.
Keep in mind that the Nasdaq is showing indications of cooling off, so Bitcoin might be ready for a big recovery if it stays above its long-term support level.
Each day's RSI measurements show that Bitcoin's ratio relative to the Nasdaq has hit new lows.
On Saturday, the RSI fell to 14.70, marking the lowest point ever recorded. The former record stood at 14.88, established in February, prior to a recovery in BTC prices exceeding 30%.
What Other Technical Readings Show
TradingView's technical analysis overview based on key data from moving averages, oscillators, and pivots for the week ahead showed sell signal.
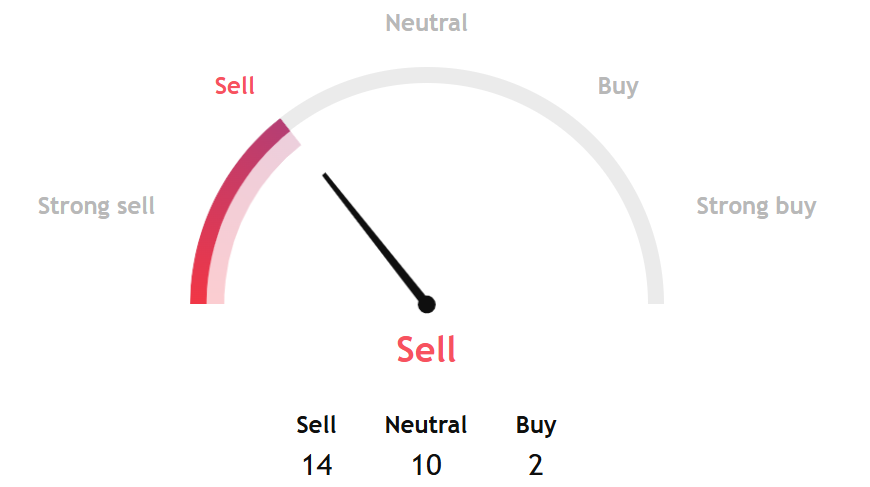
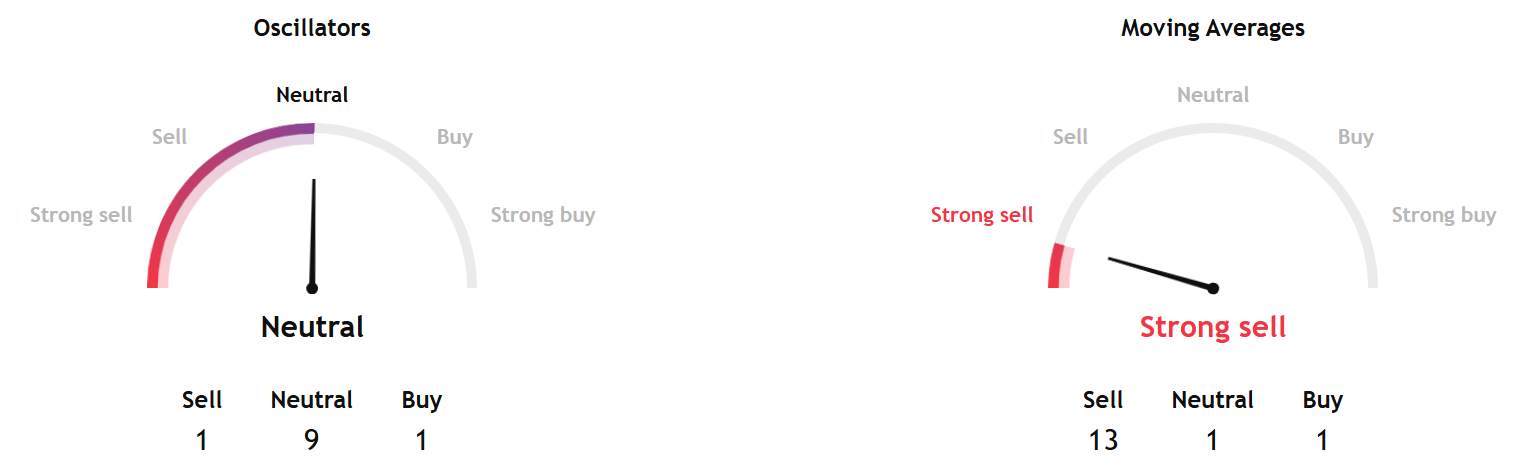
While moving average measures pointed to a strong sell signal, oscillator indicators struck a neutral tone.
Separately, InvestTech's Algorithmic Overall Analysis and one to six weeks recommendations showed a negative reading.
The research said, "Bitcoin has broken the falling trend channel down in the short term. This signals an even stronger falling rate, but the negative development may result in corrections up in the short term. There is no support in the price chart and further decline is indicated. In case of a positive reaction, the token has resistance at $66,000.
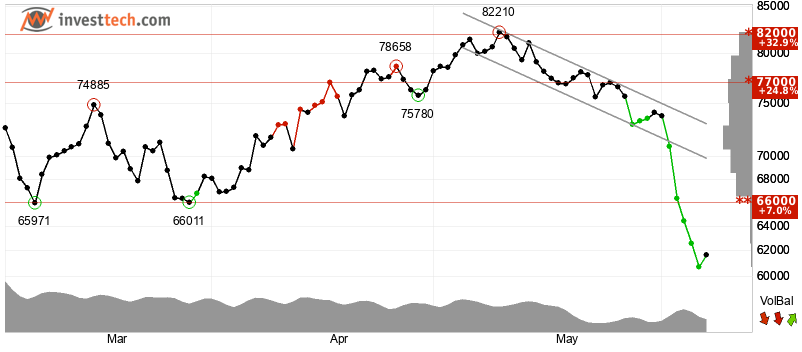
InvestTech added, ""Negative volume balance indicates that sellers are aggressive while buyers are passive, and weakens the currency. The short term momentum of the currency is strongly negative, with RSI below 30. This indicates increasing pessimism among investors and further decline for Bitcoin. However , particularly in big stocks, low RSI may be a sign that the stock is oversold and that there is a chance for a reaction upwards. The RSI curve shows a falling trend, which supports the negative trend. The token is overall assessed as technically negative for the short term."


