
Table of Contents
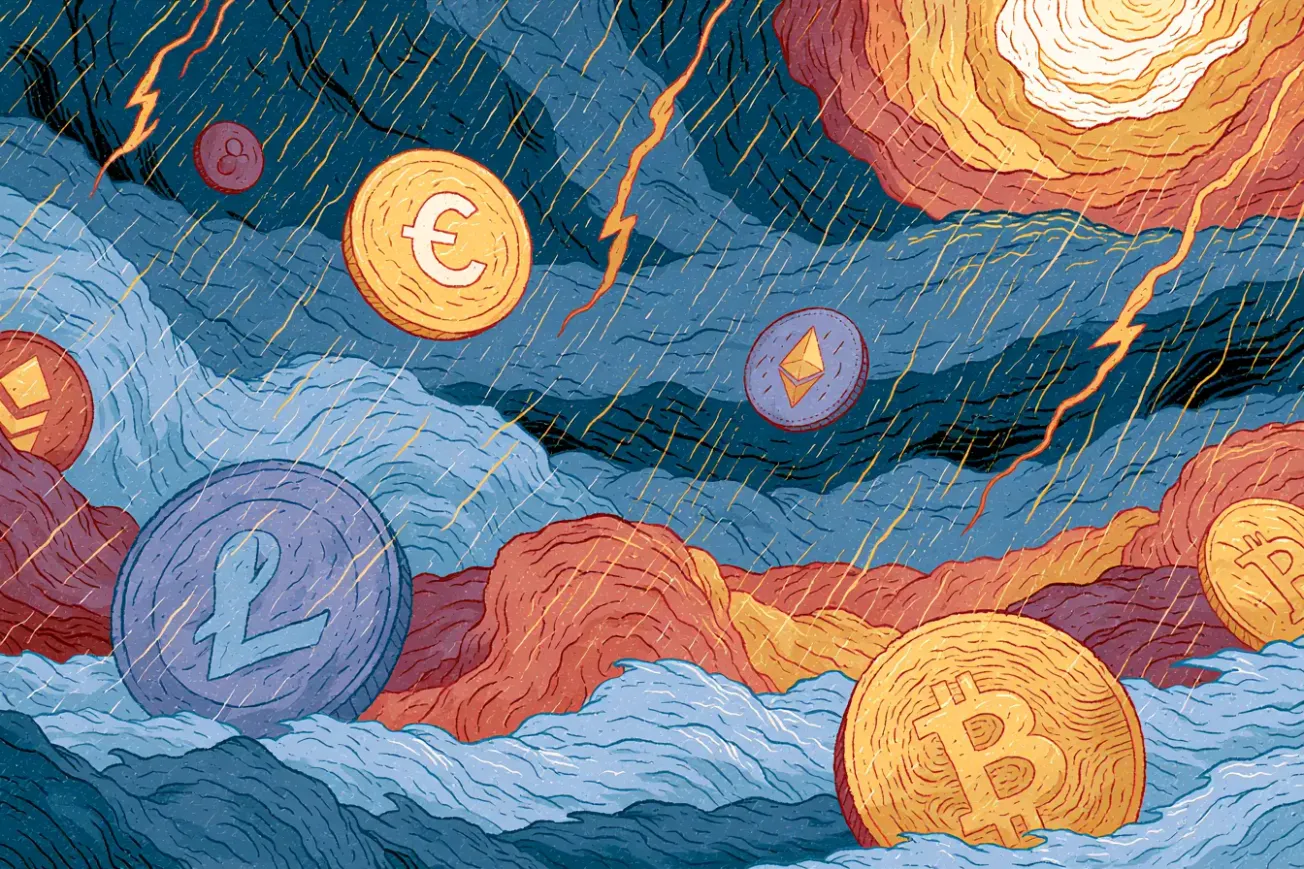
Bitcoin rose 3% to $69,200 on Monday as dip buyers flooded the market. The 3.7% gain in Ether price suggests that cryptocurrency in general is in high demand, not just Bitcoin in particular.
US President Donald Trump ramped up his social media warnings over the weekend, threatening Iran with dire repercussions and suggesting that strikes on power facilities might begin as soon as Tuesday in the event that the Strait of Hormuz remains shut.
In light of these recent developments, the price of crude oil has risen back up to $110 a barrel.
Over the past few weeks, Bitcoin's price has fluctuated between approximately $63,000 and $72,000, with limited success in breaking above the upper limit. Nevertheless, when compared to other risk assets, it has done very well.
It had a life high of almost $126,000 in October, and it's now over 50% lower.
Nevertheless, a storyline of crypto distinct from the war, oil price swings, and stock market corrections that occurred over the past five weeks has evolved gradually.
$70K Wall
There have been many failed efforts to break above the $70,000 level, which is located at the upper edge of Bitcoin's recent trading range.
If this could be closed with ease, it would change the short-term technical picture and likely attract momentum buyers waiting for confirmation.
The recent upswing comes after two previous ones that were triggered by the same technical signal on the 8-hour chart over the last week.
Whenever this signal has been triggered, it has consistently led to a rise in value. However, on each occasion, the recovery has not managed to surpass that specific range. The outcome of this trend, whether it thrives or falters like the previous two, hinges on insights that can be gleaned from on-chain data.
The $63,000 to $72,000 area has been strong since Bitcoin's top in October, and a reversal at $70,000 would further solidify the pattern of lower highs. Then Monday's 3% change isn't the start of a new trend, but simply some minor fluctuations inside a larger consolidation phase.
According to TradingView, everything changes in terms of the technical forecast because of the Tuesday Iran deadline. Attacks on Iranian infrastructure are likely to increase oil prices and decrease the value of risk assets, which might put Bitcoin's support level under strain.
If tensions were to subside, the war premium in the markets would go away, giving Bitcoin the macro support it needs to break beyond $70,000 for good.
Same Barriers As Last Week?
TradingView showed that a series of short-term positive divergences has been visible on the 8-hour chart of the Bitcoin price.
Every time the price made a lower low, the momentum oscillator known as the Relative Strength Index (RSI), which measures the rate and direction of price fluctuations, recorded a higher low.
A decrease in selling pressure is typically signalled by this pattern, which is typically followed by a turnaround.
On March 31, with February 3 as the starting point, the first divergence was finalized. Before the impetus died down, the price of Bitcoin jumped 4.83 percent.
Last but not least, the second one concluded on April 3 and had the weakest bounce at just 1.47%. The third one ended on April 5 and has brought the price back up to $69,192, a gain of 4.24% so far.
A commonality emerges from all three demonstrations.
Above $69,182, where one of the previous recoveries had levelled off, none of those moves was able to establish a solid close on the 8-hour chart.
In its third endeavor to build enough momentum to transcend the level where the previous two attempts failed, the price of Bitcoin is presently hanging just over that mark.
Those making transactions behind the scenes are equally as important as the chart patterns when trying to decipher market movements.
The explanation for why the divergences haven't led to a lasting rally can be observed in two on-chain datasets. First, there is the concentration of powerful players. Indicative of the market's biggest players, the number of organizations holding 1,000 BTC or more peaked at roughly 1,281 in mid-March.
The figure has steadily dropped since then, reaching 1,266 as of April 5. The decline of fifteen high-value wallets during the previous three weeks suggests that the concentrated buying power, which often drives breakouts, is waning rather than growing. During the time that the three divergences were taking shape – that is, after March 29 – the slump became much worse.
The second factor is the actions of long-term asset holders. The net position change for long-term holders, which tracks the actions of people who have consistently invested, peaked at 163,262 BTC on or around March 22.
With a decline of over 47% as of April 5, the total has dropped to 87,038 BTC. Although they are still committed, long-term holders' faith has waned.
Breakout Or Bust?
The current hurdle stands at $69,920. If that level can be sustained for at least another eight hours, it would suggest that the 1.7% supply cluster at the current range missed this rally, marking a significant shift from the pattern established by the last two divergences.
After the price breaks $69,920, the next target is the $71,956 swing high. If Bitcoin's price closes above this level, it will have broken from the range it has been in since late March.
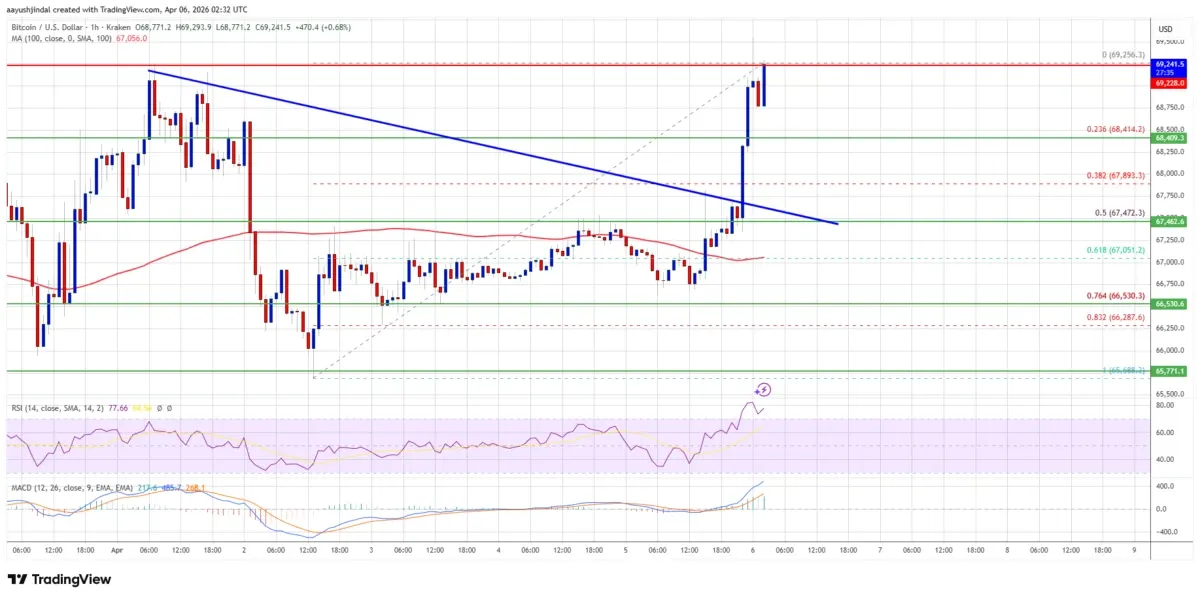
When looking to sell, $68,660 is a strong area of support for Bitcoin.
A strong support level beneath it has been $66,624 since the end of March. If that level doesn't hold, the entire framework is severely damaged; thus, $63,329 is the next crucial level to keep an eye on.
45-Day Ceasefire Talks & Crypto
The price of Bitcoin experienced a modest increase following a report from Axios indicating that the US and Iran were contemplating a 45-day ceasefire, which could potentially pave the way for the conclusion of the conflict.
The report was sourced from Barak Ravid, a highly influential journalist within the field.
Trump has indicated a potential significant military action in Iran, targeting infrastructure such as bridges and power plants, which raises serious legal and ethical concerns.
Iran has suggested that such an action could result in heightened tensions, as the nation concentrates on developing infrastructure in various Middle Eastern countries.
The price of Bitcoin could see significant improvement if the conflict were to come to a close, for several reasons.
Initially, this would alleviate anxiety and fluctuations in the market, positively impacting high-risk assets.
Secondly, this arrangement could result in easing crude oil prices, which is significant given that West Texas Intermediate has surged to $112 and surpassed Brent, the global standard.
A decline in energy prices could contribute to easing inflation, which experts anticipate will keep climbing amid the ongoing conflict in Iran.
The forthcoming US inflation report is expected to reveal that the headline Consumer Price Index (CPI) increased to 3.4% in March, up from the prior 2.4%.
The latest data reveals that spot Bitcoin ETFs have experienced a decline of $164 million this month, following a substantial increase of $1.32 billion in the prior month.
A bearish flag pattern is taking shape, which is a continuation indication that is often seen in technical analysis, and Bitcoin is now traversing an upward channel.
The price is sitting slightly below the $71,457 level that represents the 50% Fibonacci Retracement.
What Other Technical Readings Show
TradingView's technical analysis overview based on key data from moving averages, oscillators, and pivots for the week ahead showed a sell signal.
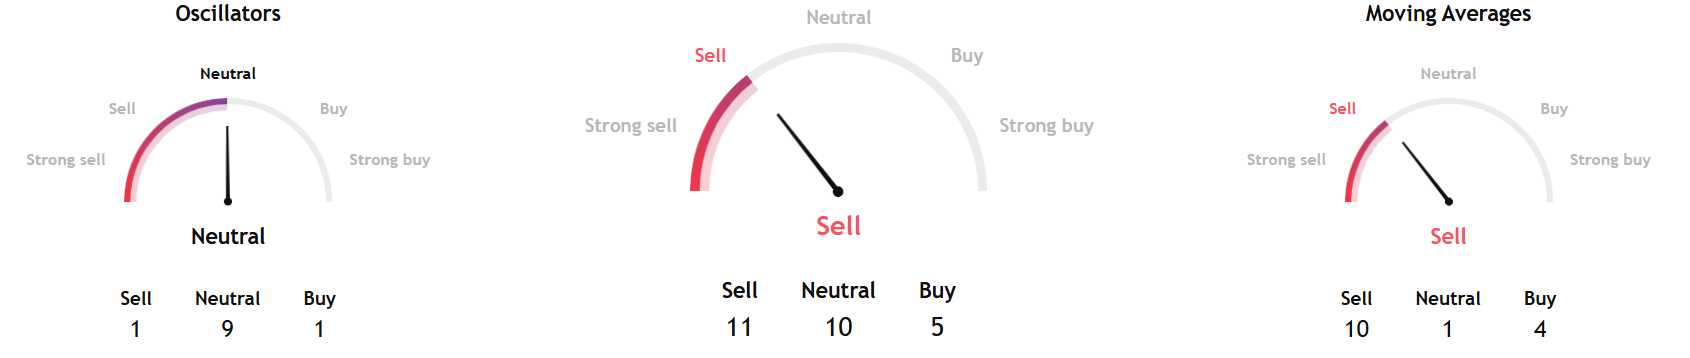
Separately, InvestTech's Algorithmic Overall Analysis and one to six weeks recommendation pointed to a hold score.
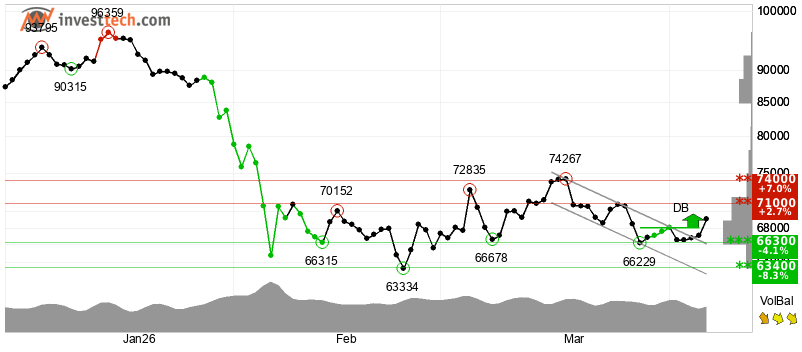
In the short term, the research said, "Bitcoin has broken the ceiling of the falling trend in the short term, which indicates a slower initial falling rate. The token has built a double bottom formation and given a signal of further rise to $69,769. On reactions back, there is now support at $68,120. The token is approaching resistance at $71,000, which may give a negative reaction."
InvestTech added, "However, a break upwards through $71,000 will be a positive signal. Volume tops and volume bottoms correspond well with tops and bottoms in the price. This strengthens the token. The RSI curve shows a rising trend, which could be an early signal of the start of a rising trend for the price as well. Bitcoin is overall assessed as technically neutral for the short term."
Be at the heart of TradFi–DeFi collaboration at Money20/20 Asia 2026.

Are you looking to forge partnerships with banks and fintechs? To expand into new markets across Asia, or to secure funding from top-tier investors? This April, the world of digital assets, blockchain, and Web3 converges with the biggest players in APAC’s financial ecosystem at Money20/20 Asia 2026 and its brand new ‘Intersection’ zone, complete with a dedicated content stage, TradFi-Defi innovator showcase, and curated networking spaces. From traditional banking giants to decentralised innovators, private equity leaders, and cutting-edge fintech disruptors, this is where they meet to forge partnerships, spark dialogue, and shape the future of finance.


