
Table of Contents
After giving up its gains from Friday, Bitcoin fell more than 4% on Monday to a low of $64,300, bringing the Crypto Fear and Greed Index to its lowest point.
There was a further $458 million at stake for more than 136,000 dealers on the past day, who risked liquidation. Most notably, according to CoinGlass's reporting, leveraged long bets accounted for 92% of all liquidations.
Bitcoin had modest price gains over the weekend, with Saturday seeing a peak of $68,600. But after its sharp decline to $60,000 on February 6, it has formed a range-bound channel, and it is now resting at a support level within that channel. As of publication time, the token was trading at around $65,000.
Compared to its all-time high of $126,000 in October and its highest of $69,000 during the 2021 bull market, Bitcoin's present price is 48% lower.
A recent decline to 5 out of 100 on the Crypto Fear and Greed index indicates a level of "extreme fear" among market participants of Alternative.me.
Just three times since the index's inception in 2018 – in August 2019, June 2022, and this month – has that level been hit.
The seven-day moving average for net realized losses is approaching $500 million per day, based on recent data from an on-chain analytics firm, indicating that new investors are continuing to capitulate.
Those engaged in the initial phase are still seeing returns, even though the prevailing climate suggests a market experiencing difficulties.
'Phenomenal chart' published by CIO & Founder of MNFund, Michaël van de Poppe, on Saturday shows that Bitcoin's Sharpe Ratio has fallen to -38.4, traditionally signifying 'low risk' accumulation zones.
This is a phenomenal chart.
— Michaël van de Poppe (@CryptoMichNL) February 21, 2026
It shows the Sharpe Ratio for #Bitcoin in the short term.
The key takeaway: the Sharpe Ratio has dropped to -38.38, which historically has marked "Low Risk" accumulation zones. The red circles highlight every time the Sharpe Ratio dipped to similar… pic.twitter.com/Nwp7SkfVP4
The ratio evaluates Bitcoin’s performance in relation to the risk involved, showing the potential return an individual might anticipate for every unit of risk undertaken.
What the Other Technical Measures Show
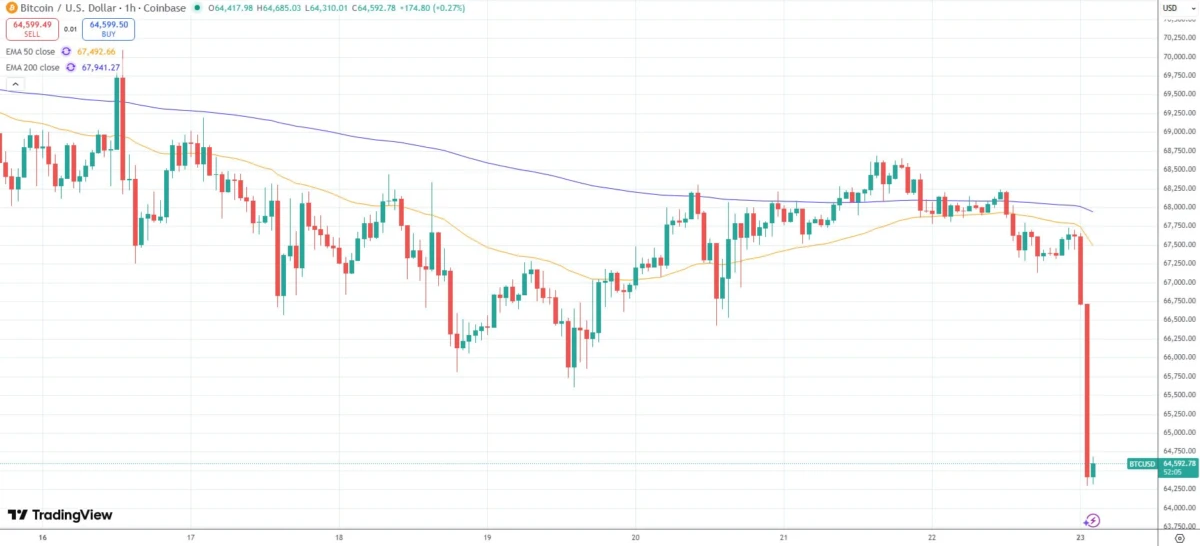
TradingView's technical analysis:
- Hourly MACD - The MACD is currently moving quickly into the negative zone.
- The relative strength index (RSI) for Bitcoin/USD on an hourly basis is now below 50.
- Two important support levels are $64,500 and $64,200.
- The key levels of resistance are $66,000 and $66,500.
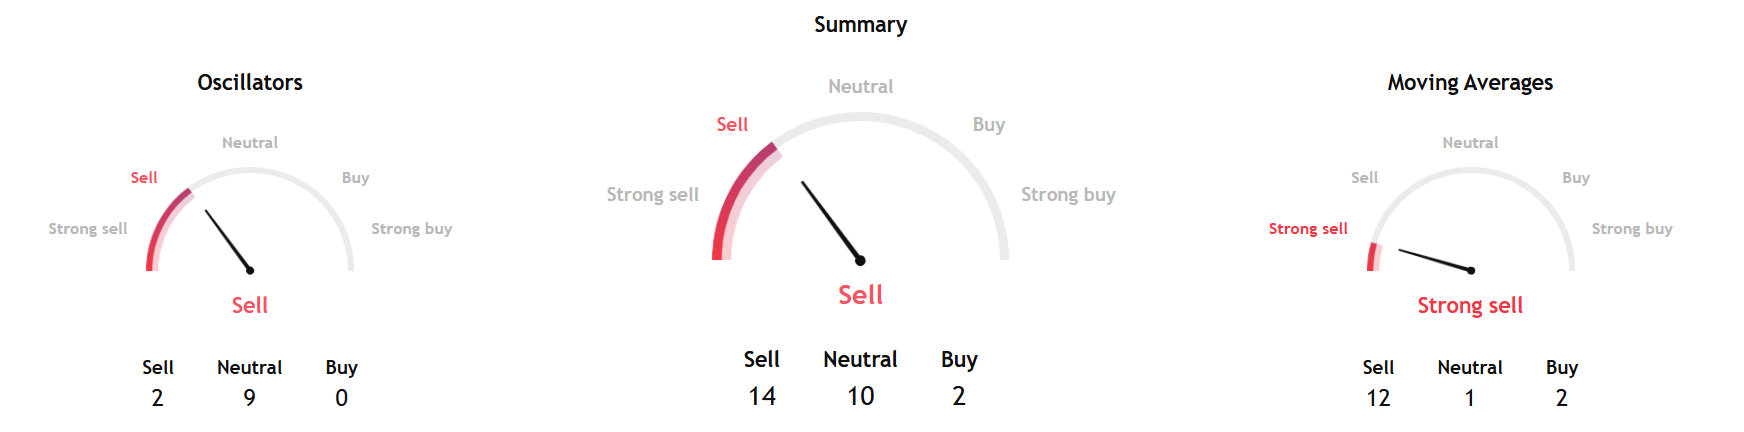
TradingView's technical analysis overview based on key data from moving averages, oscillators, and pivots for the week ahead showed a sell signal.
Separately, InvestTech's Algorithmic Overall Analysis and recommendation for one to six weeks gave a "weak negative" score.
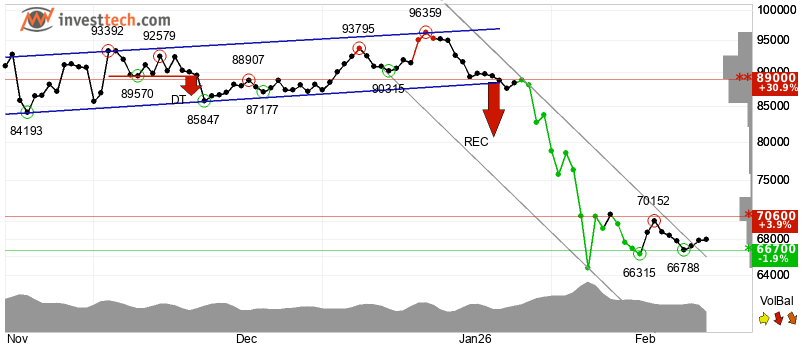
In the short term, InvestTech said, "Bitcoin has broken the ceiling of the falling trend in the short term, which indicates a slower initial falling rate. The token is between support at $66,700 and resistance at $70,600. A definitive breakthrough of one of these levels predicts the new direction."
The research firm added, "Negative volume balance weakens the currency in the short term. RSI diverges positively against the price, which indicates a possibility for a reaction up. The token is overall assessed as technically slightly negative for the short term."


