
Table of Contents
The price of Bitcoin has fallen beneath $90,000, along with the 100-hour simple moving average. The price could potentially rise once more if the buyers maintain their momentum.
At the $90,000 mark, we are encountering significant resistance. The $90,500 mark represents the first significant hurdle to overcome. On the hourly chart of the BTC/USD pair, a bearish trend line is emerging, with resistance positioned at $90,650.
TradingView's Market analysis tools:
- The hourly MACD is currently picking up momentum in the positive territory.
- Hourly RSI (Relative Strength Index) – The relative strength index for BTC/USD has currently surpassed the 50 threshold.
- Key Support Levels – $88,550, then $88,000.
- Key Resistance Points – $90,000 and $90,500.
TradingView's overall Bitcoin Technical Analysis gauge, based on the summary, is based on the most popular indicators, such as moving averages, oscillators, and pivots, and points to a neutral signal for the coming week.
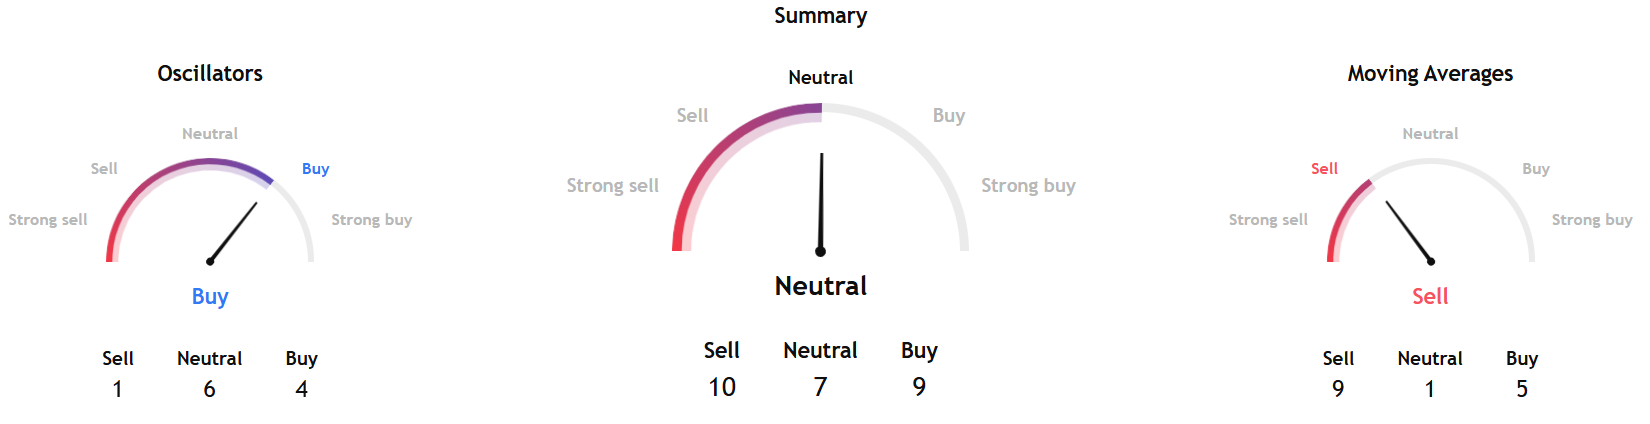
Separately, InvestTech's Algorithmic Overall Analysis and recommendation for one to six weeks pointed to a hold signal.
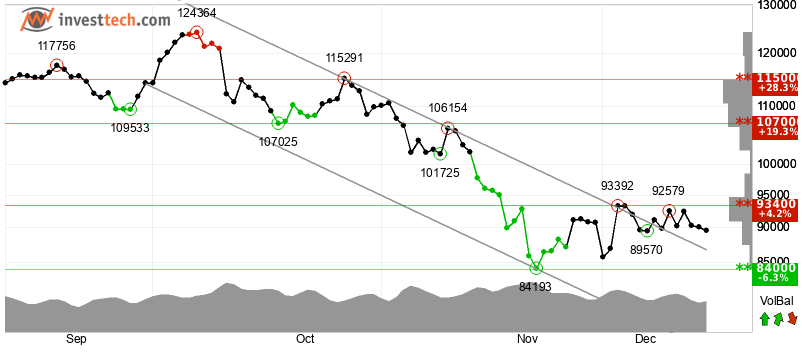
Investech said, "Bitcoin has broken through the ceiling of a falling trend channel in the short term. This indicates a slower falling rate initially, or the start of a more horizontal development. The token has support at $84,000 and resistance at $93,400."
The firm added, "Positive volume balance shows that volume is higher on days with rising prices than on days with falling prices. This indicates increasing optimism among investors. The token is overall assessed as technically neutral for the short term."


