Table of Contents
I thought we could look at three things quickly today, as it’s the end of the week. The first is the concept of “M” shaped tops in price charts.
I have plotted a green swing line following the price trajectory from March 2020 to current date (Bitcoin basis weekly data here). You can see the clear “M” shape into the top of the price cycle. Some technicians would call this a “double top” but what is happening beneath the surface is this the longest cycle (the arc shown) consists of two harmonic shorter cycles, which in turn consist of two harmonic shorter cycles and so on all the way down. This is just the way cycles work, they are like Russian dolls.. they nest within each other and the ratio is typically 2 to 1. The “M” top is simply the two next shorter cycles’ trough, which pulls down the peak in the long arc.
The next thing to note are the mid-wave pauses to the left and right, these are caused by the peaking of the cycles one quarter of the length of the main arc. And they match across the entire price trajectory even though across the diagonal. Some technicians might look at these as the shoulders of a complex head and shoulders top.
The takeaway is look for “M” shapes in your charts and try to visualise the cycles at work beneath the surface. Because what we see on the charts is simply a composite of all of the cycles present interacting with each other..
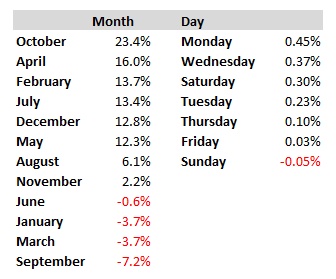
The table below shows open to close performance according to months of the year (and bear in mind we only have seven years for Bitcoin) and open to close performance for days of the week.. Just for fun and that…