Table of Contents
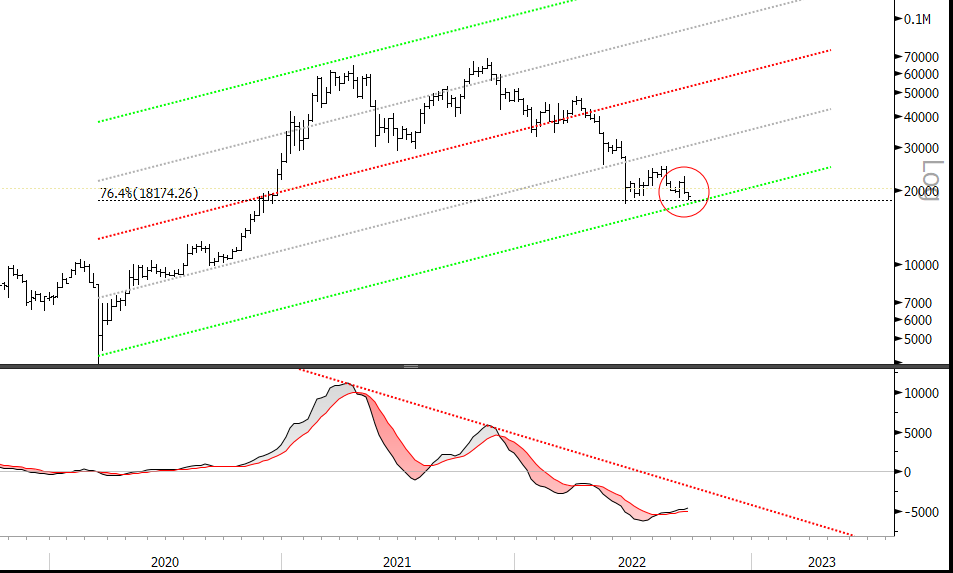
The weekly Bitcoin chart here shows that price is now testing the March 2020 regression channel two standard error lower boundary. This is more or less the same as saying it is two standard deviations below the average, which implies overstretched to the downside.
At the same time the move down from the last peak in November 2021 is testing a key balance point that of the 76.4% retracement of the March 2020 to April 2021 advance.
The sub-window shows that MACD is slowly attempting an unwind of downside power. The entire set up here is hinting at a reaction rally and is consistent with the view that the US dollar has limited upside in its current advance as it gets sucked up into its 20 week cycle peak, which is close now.
The expectation therefore is for some sort of reaction rally in Bitcoin shortly, but at present the forecast is not for a major advance. We will be keeping a close eye on price over the next five days to update the analysis, but be on alert.