Table of Contents

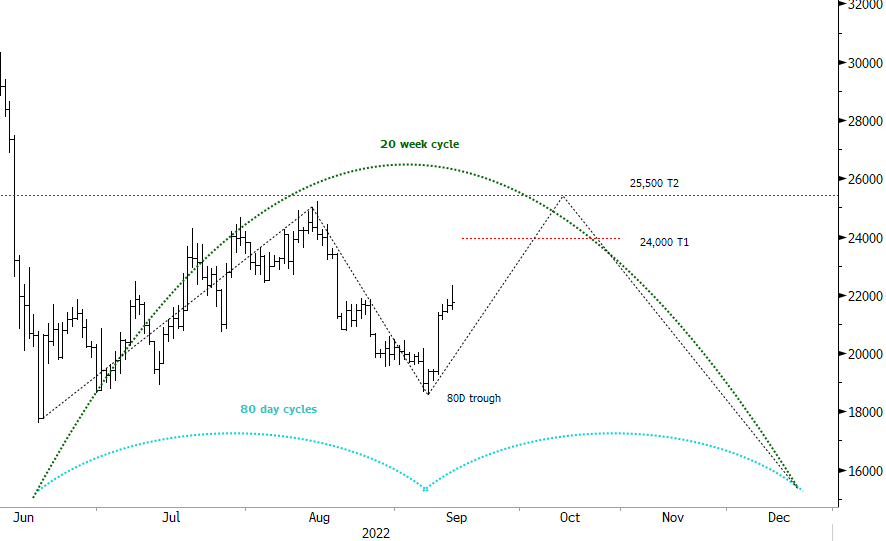
Here, we’re looking at the Bitcoin daily chart. As forecast in the last note on Bitcoin a few weeks back, the 80-day cycle trough has come in on cue around mid-September.
A new 80-day cycle (blue) is now rising and offers profit potential, but note that the underlying trend (namely the effect of cycles longer than the 80 day) is effectively down/neutral. This means that the potential for a big rally is limited. In short, the new 80-day cycle upswing has a headwind and the main one we are looking at in the chart is the 20-week cycle (green) cycle shape.
The 20-week cycle is due to bottom in later November, but this is likely to pushed out in time to early December. We often see troughs pushed forward in time in a broader downtrend and by the same token, the peaks tend to come in early. This means that as the current advance progresses the headwind will have more effect as the 20-week cycle starts rolling over (think vectors: 80-day arrow pointing up, 20-week pointing steeper down as time elapses).
For now we are stalking the first upside target around US$24,000 and then US$25,500. This latter target, if reached, is not expected until early October.


