Table of Contents
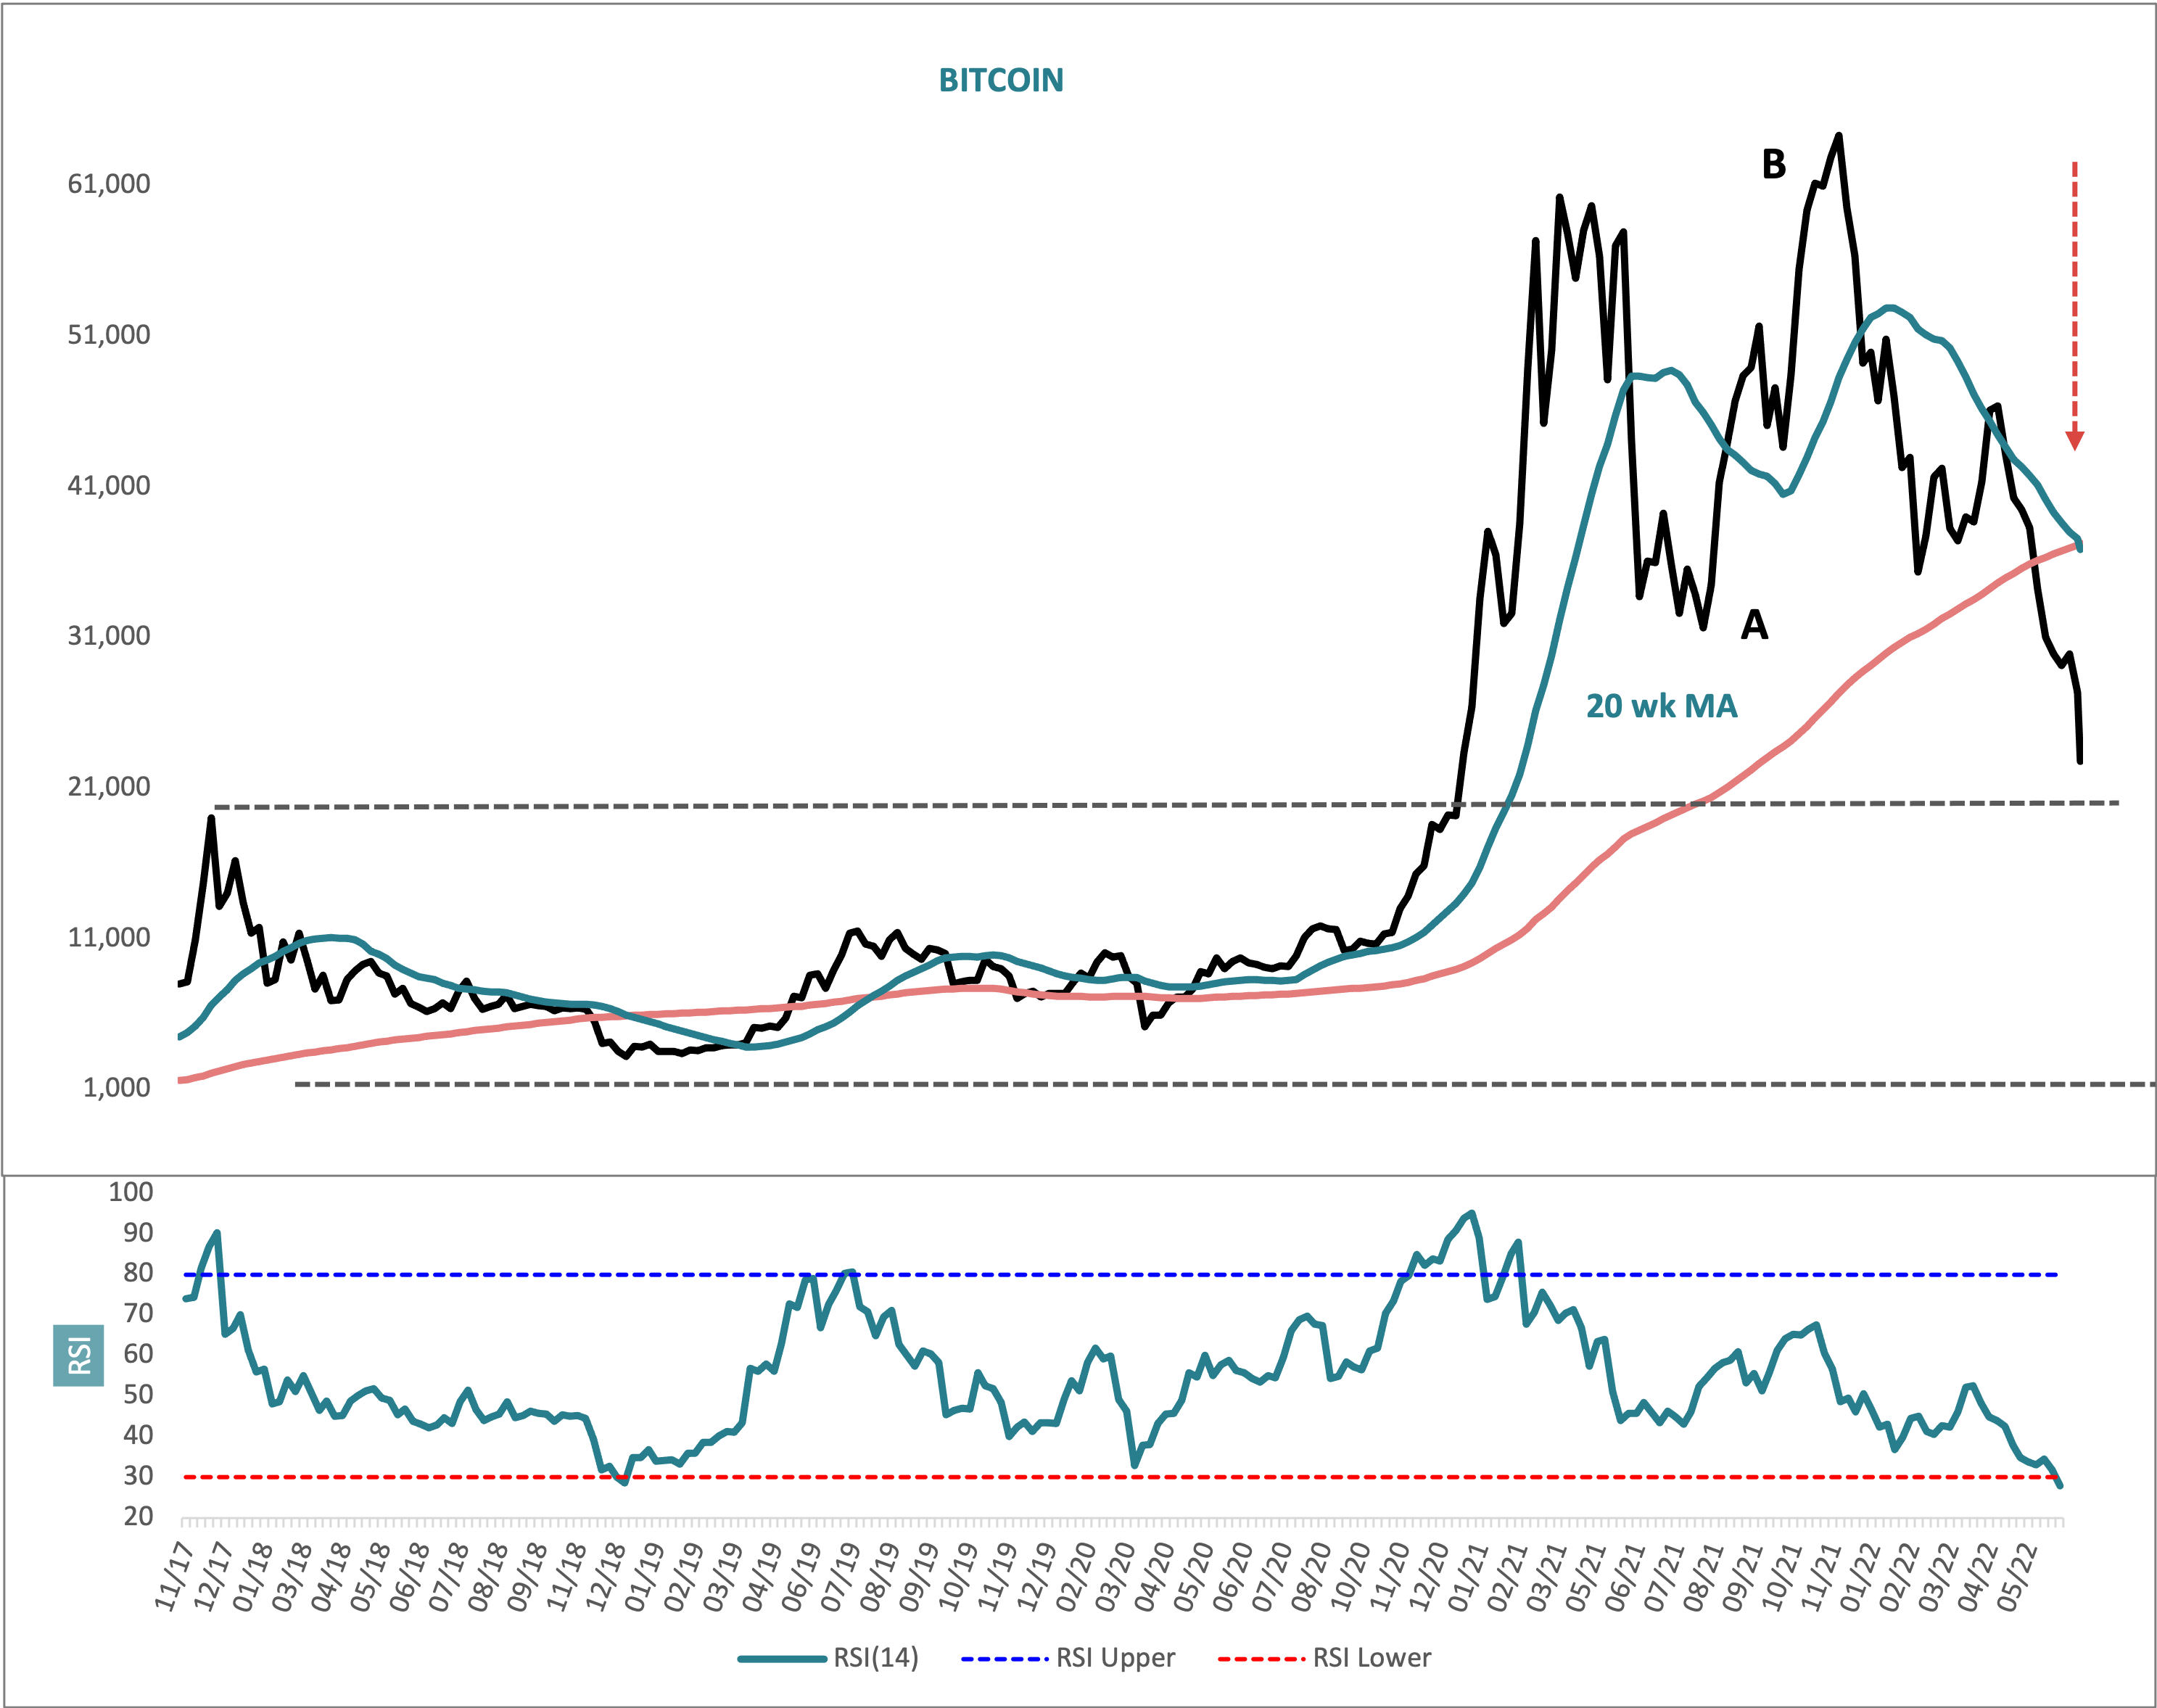
Weekly RSI(14) is right back at decade lows. This is the fourth time it has touched the 20 to 25 zone since September 2014. The last three times occurred ahead of big advances.
A long horizontal level can be plotted from the December 2017 spike high at 19,041 and this is within easy reach 15% lower. This is a potentially meaningful long term balance point.
There has just been a so called dead cross in the 20 and 100 week simple moving averages. This is where the shorter 20 week crosses down through the 100 week. Text books tell us this is bearish, but that is not actually the case. They often occur near market capitulations. In fact, the last time we had a dead cross in December 2018, the market settled and then rallied hard.
I have labelled the wave structure from the April 2018 top as an ABC zigzag. I will get into these patterns in more detail in the next teaching note, but this pattern (if thats actually what it is) is a correction. Sharp A wave down, followed by a three part B wave up which puts in a false upside breakout and then collapses into the final C wave down. Its called an expanded flat and I think we are near the end of the final C wave.
In terms of market sentiment you could call the bottom of the C wave one of despair at the market, disgust even. But its always the darkest before dawn. I don’t think its time to throw the towel in on Bitcoin is the upshot.