Table of Contents
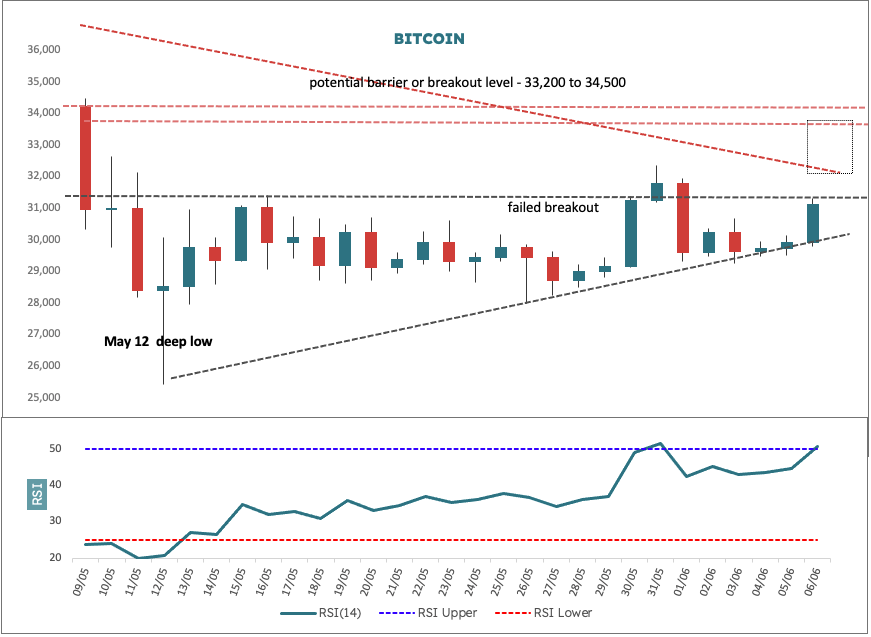
Bitcoin’s deep low of May 12 ( in the above chart) is significant. Typically RSI is calculated off the close, but you can just as well calculate off any price point: the open, the high, the low or the close (typically referred to as OHLC) or combinations thereof (OHL/4, HL/2 and so on).
The lower wick of the candle on 12 May is notably long, which points to sellers being unable to control the lows intraday and was therefore potentially bullish. Since that day’s candle visually stood out so much, I wondered how the RSI off the low calculation would look and it turns out it was the lowest reading at 13.8 since 13 March 2020 (which was 12.4). This actually preceded a 1,600% advance over the next 14 months. The next lowest reading was 20 November 2018 at 16, which preceded a 320% rally.
Now while its important not to get all giddy and ahead of ourselves here, we have seen and tracked in recent notes that price has just undergone a significant volatility squeeze and that we have also been aggressively testing key support going back to January 2021. So something appears to be going on that could be a set up for a good move higher.
If we look at the price action near term we can see that price has been uniformly supported by an upsloping trend line plotted off the 12 May low (seven times now) and typically when we see price creeping along at support like this it is an indication that a decent up move is brewing.
Above us now there is a confluence of potential resistance between roughly US$33,200 and US$34,500. Resistance cleared means breakout, so this is the next upside target of interest.