Table of Contents
A few notes back we looked at the concept of a volatility squeeze using Bollinger bands. These are simply two standard deviation bands around, in this case, a 10 day moving average. If the spread is narrow, it implies a flat moving average with very little price distribution around it.
In other words, price volatility is much diminished. Low volatility is a lead indicator for high volatility, although the direction of the breakout cannot be ascertained from the squeeze alone. Technicians using Bollinger bands in their chart work are always on the lookout for squeezes and afford them a lot of respect.
The spread between the upper and lower bands can be compared to price to standardise and the reading yesterday was 4.9%. Looking back into the data we see the last time the bands were so tight in a low market was the first week of October in 2020. This squeeze preceded a significant market rally. The time before then was towards the end of July 2020, which saw a price surge, which ultimately set up the October 2020 rally. There was a mini cluster leading into the point too.
Another volatility measure we have also looked at in prior notes is average true range. This is an average of how much price is shifting around against itself over a certain look back period. The current ATR versus price is a low 4.5% and the last time we saw values this low was the last week of December 2020. This too preceded a significant market advance.
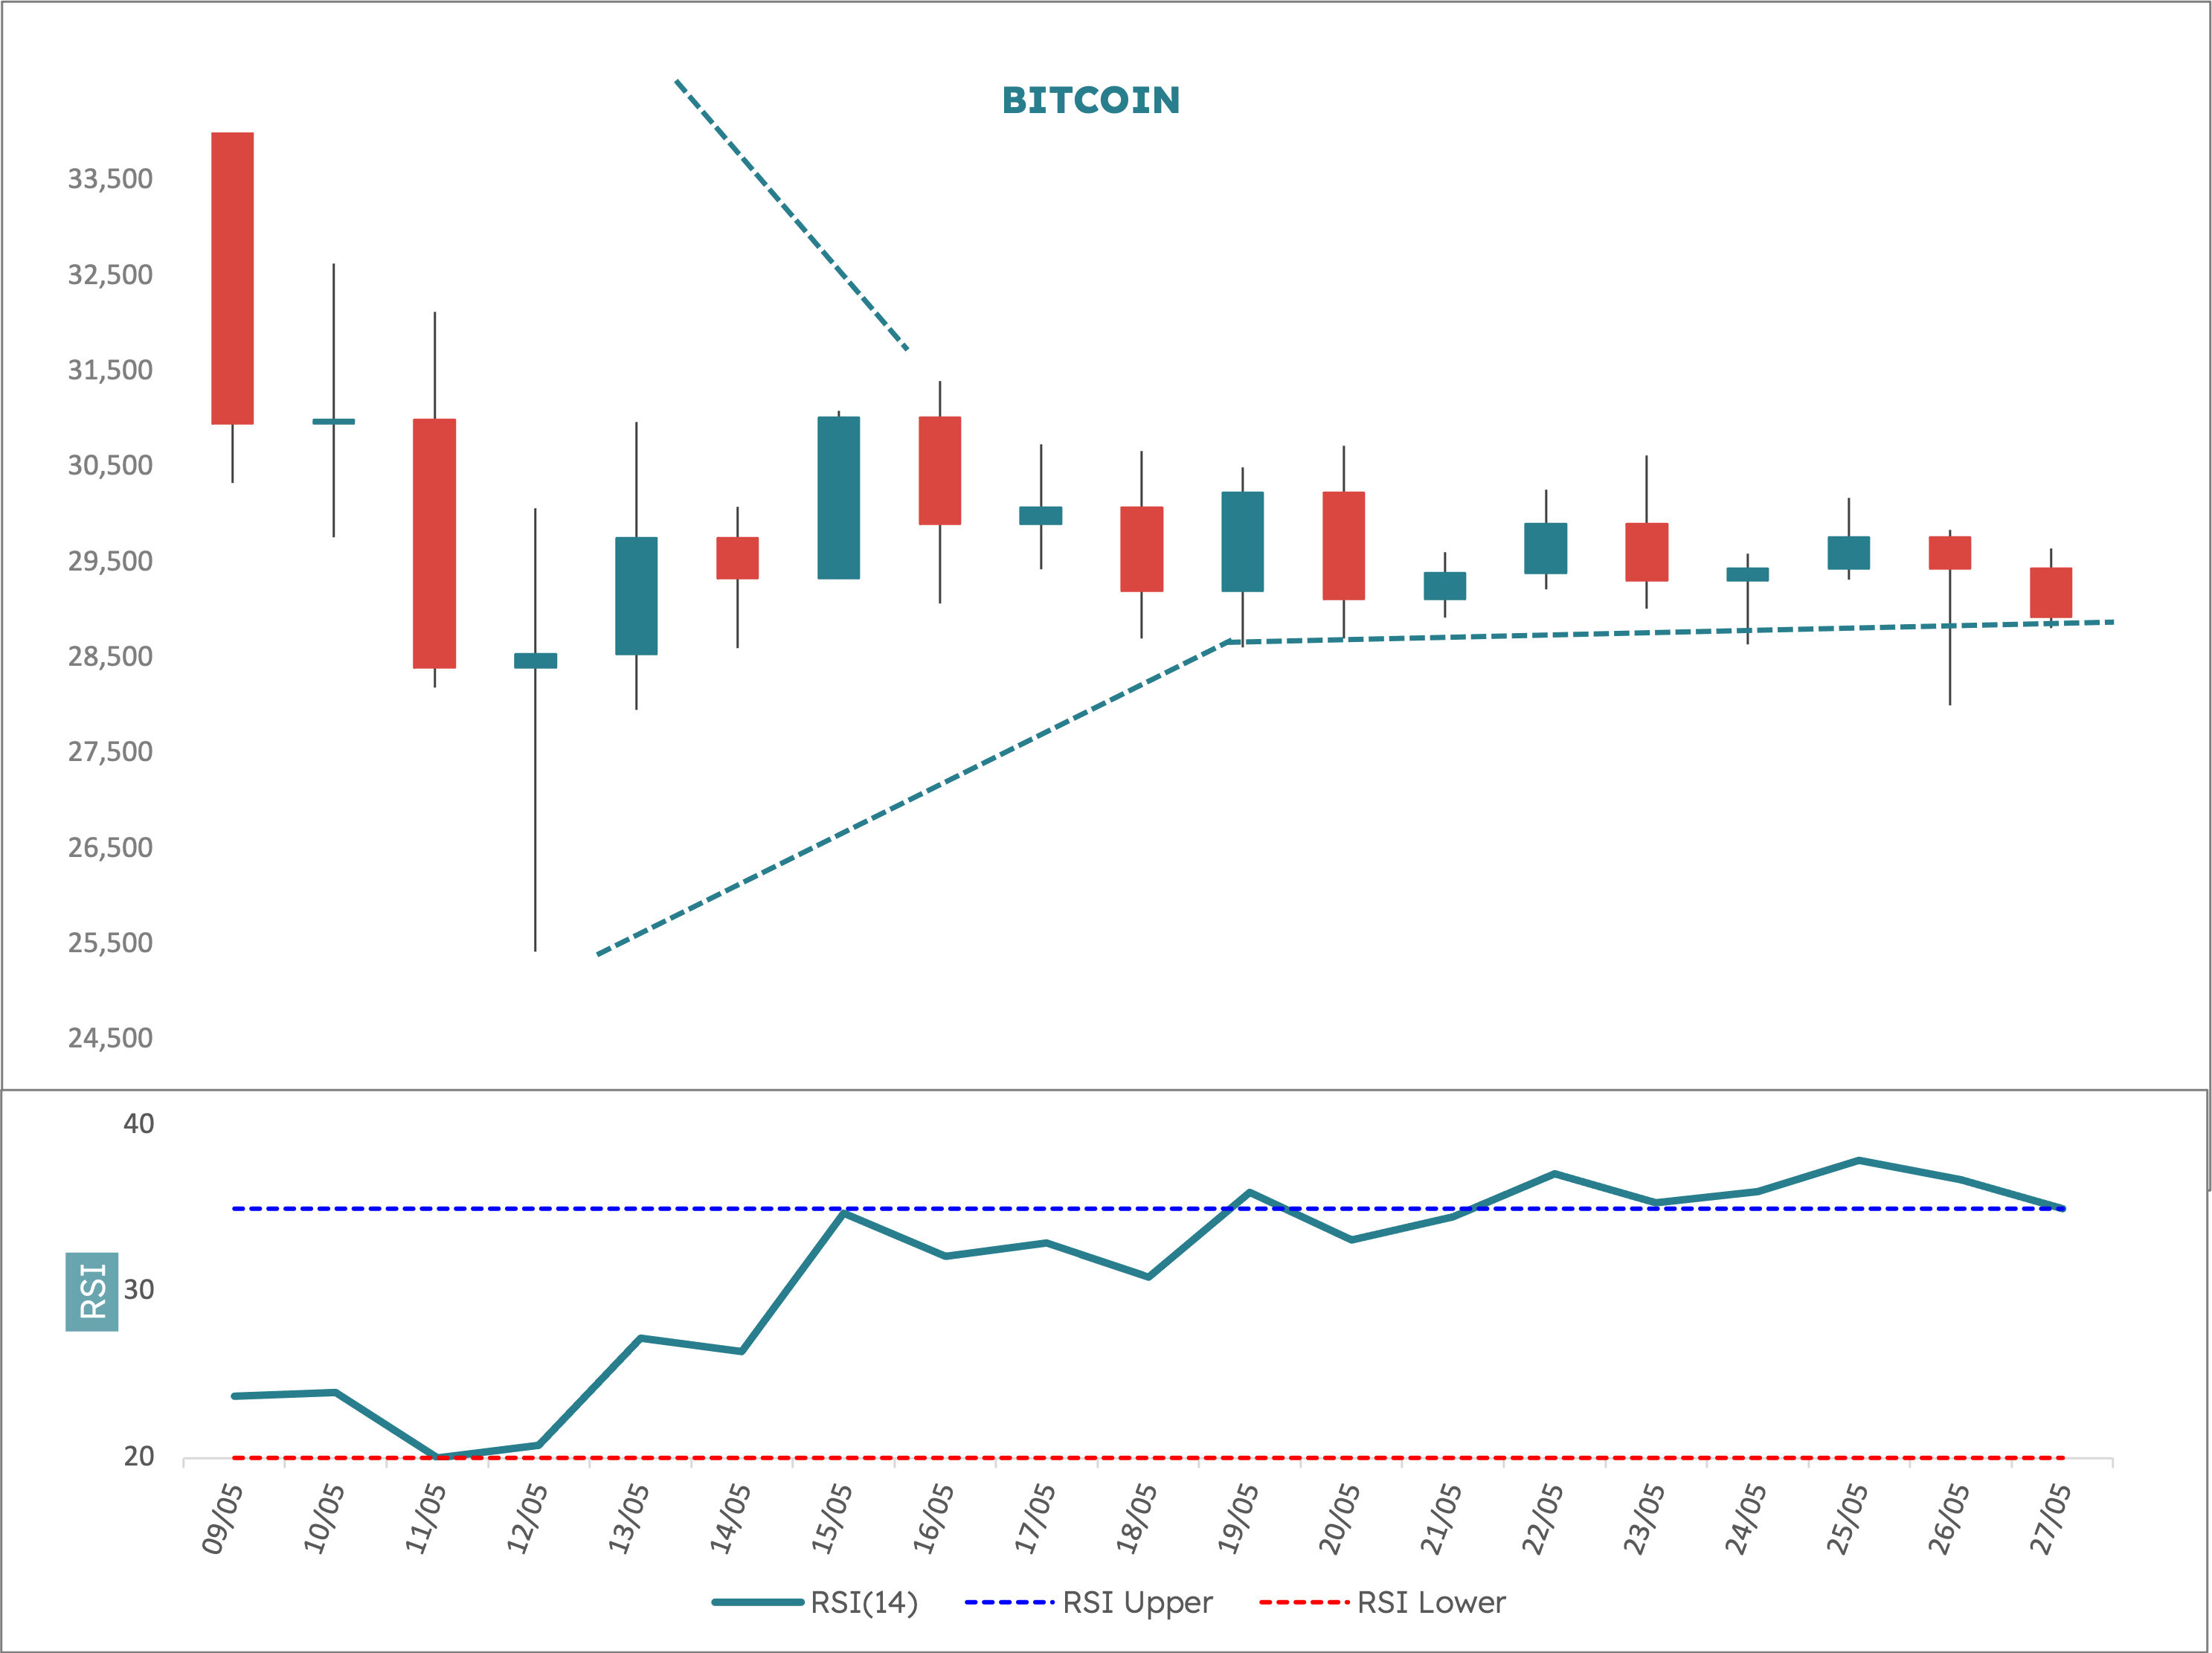
The takeaway is this: if the current squeeze does lead to an upside breakout it should be explosive. Interestingly, the last time we have RSI as depressed as it was on 10 May was at the big price low mid March in 2020. This again preceded a significant advance. With key support quite close at hand and equity markets at least trying to reverse up, the outlook for Bitcoin remains cautiously bullish.