Table of Contents
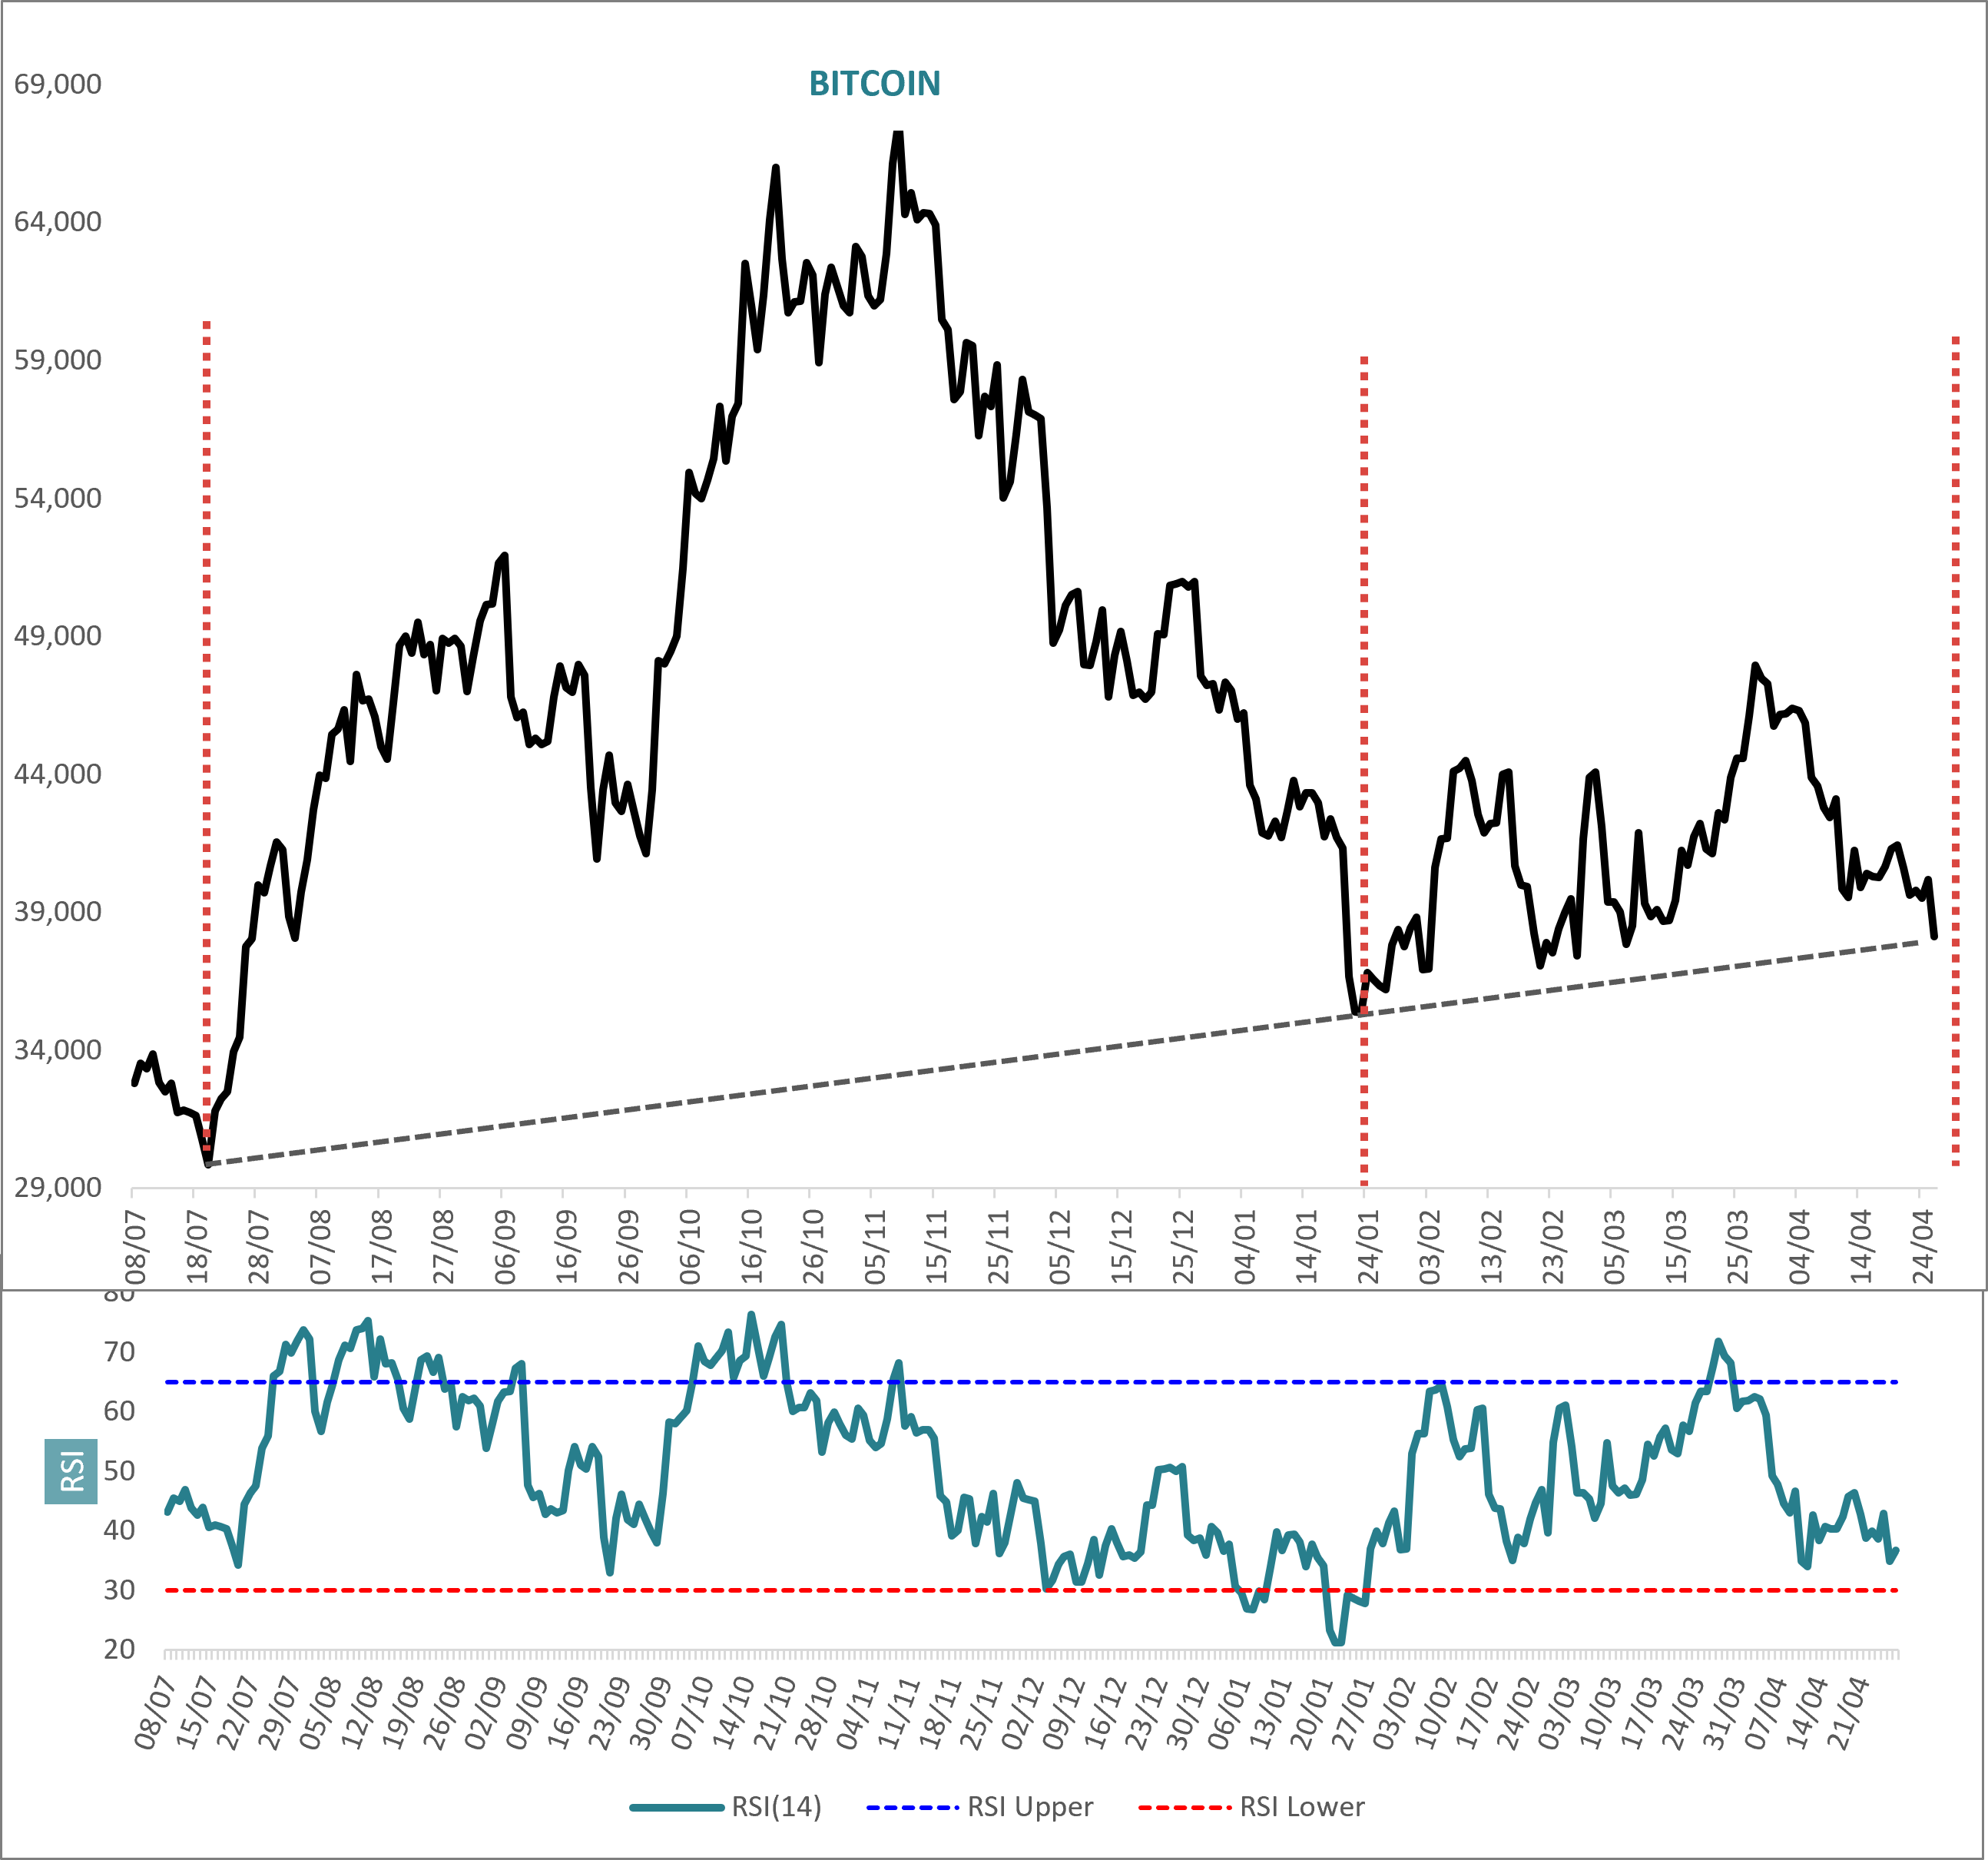
The red vertical lines in the price chart represent the troughs of a roughly 100-day cycle in the data. This is more or less an expected cycle in all market data and many naturally occurring phenomena as well in fact. At the same time, an uptrend “support” line can be plotted from the 20 July 2021 low through that of the 22 January crash low and it projects for an intersection around about now. Put together, the implication is that we are due a meaningful upside reaction in the next week or so.
At the same time note that the most recent sell off has a classic impulse wave down look about it (delineated in the box). In other words, it flows freely and has five distinct non overlapping wave sections. If the move down is going to end, then that’s the necessary shape of the last phase. So tentatively we are looking for the entire move down from the end of March to end and reverse up.
It’s a somewhat unorthodox call in terms of the overall price pattern from the end of January, which has been more or less a random walk. Additionally, a low in Bitcoin implies a low in the the S&P500, Nikkei, Eurostoxx and such like, namely global risk in general. This is a harder call to make right here.
There is ambiguity therefore, and sometimes the markets are more opaque than we are comfortable with and conviction stances less easy to adopt. Nevertheless, something interesting is coming up.